Alaskan Athabascan vs Immigrants from Belarus In Labor Force | Age 45-54
COMPARE
Alaskan Athabascan
Immigrants from Belarus
In Labor Force | Age 45-54
In Labor Force | Age 45-54 Comparison
Alaskan Athabascans
Immigrants from Belarus
81.8%
IN LABOR FORCE | AGE 45-54
0.4/ 100
METRIC RATING
246th/ 347
METRIC RANK
83.3%
IN LABOR FORCE | AGE 45-54
94.1/ 100
METRIC RATING
101st/ 347
METRIC RANK
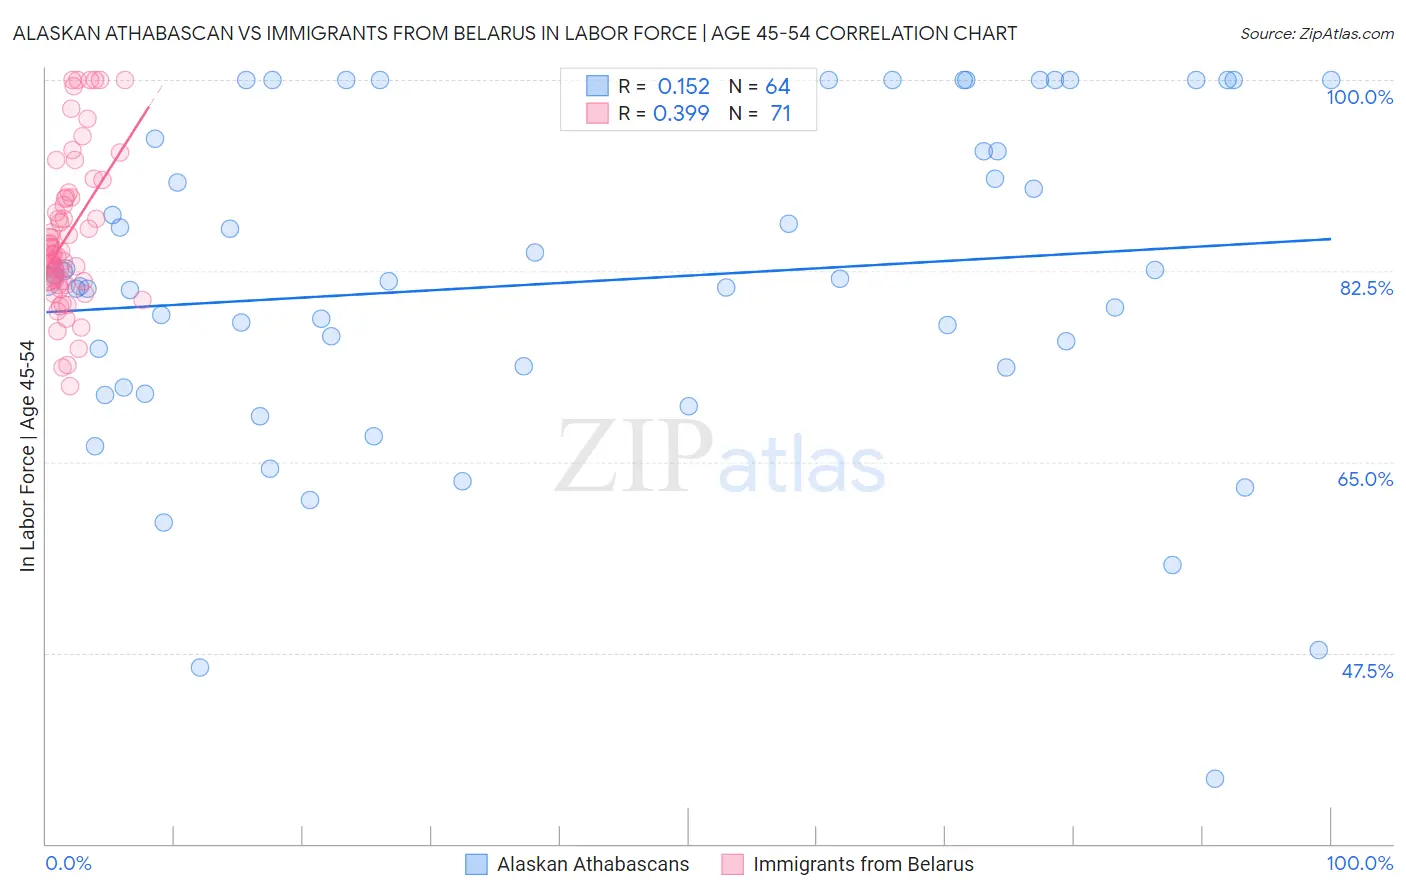
Alaskan Athabascan vs Immigrants from Belarus In Labor Force | Age 45-54 Correlation Chart
The statistical analysis conducted on geographies consisting of 45,818,095 people shows a poor positive correlation between the proportion of Alaskan Athabascans and labor force participation rate among population between the ages 45 and 54 in the United States with a correlation coefficient (R) of 0.152 and weighted average of 81.8%. Similarly, the statistical analysis conducted on geographies consisting of 150,181,664 people shows a mild positive correlation between the proportion of Immigrants from Belarus and labor force participation rate among population between the ages 45 and 54 in the United States with a correlation coefficient (R) of 0.399 and weighted average of 83.3%, a difference of 1.8%.
In Labor Force | Age 45-54 Correlation Summary
| Measurement | Alaskan Athabascan | Immigrants from Belarus |
| Minimum | 36.0% | 71.9% |
| Maximum | 100.0% | 100.0% |
| Range | 64.0% | 28.1% |
| Mean | 81.5% | 85.9% |
| Median | 81.5% | 84.3% |
| Interquartile 25% (IQ1) | 72.8% | 81.5% |
| Interquartile 75% (IQ3) | 94.1% | 89.3% |
| Interquartile Range (IQR) | 21.3% | 7.8% |
| Standard Deviation (Sample) | 15.0% | 6.9% |
| Standard Deviation (Population) | 14.9% | 6.9% |
Similar Demographics by In Labor Force | Age 45-54
Demographics Similar to Alaskan Athabascans by In Labor Force | Age 45-54
In terms of in labor force | age 45-54, the demographic groups most similar to Alaskan Athabascans are Alaska Native (81.8%, a difference of 0.010%), Celtic (81.8%, a difference of 0.020%), Central American (81.7%, a difference of 0.020%), Puget Sound Salish (81.7%, a difference of 0.040%), and Hmong (81.7%, a difference of 0.060%).
| Demographics | Rating | Rank | In Labor Force | Age 45-54 |
| Immigrants | Thailand | 1.0 /100 | #239 | Tragic 81.9% |
| Immigrants | El Salvador | 1.0 /100 | #240 | Tragic 81.9% |
| Immigrants | Cambodia | 0.8 /100 | #241 | Tragic 81.9% |
| Whites/Caucasians | 0.7 /100 | #242 | Tragic 81.9% |
| Samoans | 0.6 /100 | #243 | Tragic 81.8% |
| Celtics | 0.4 /100 | #244 | Tragic 81.8% |
| Alaska Natives | 0.4 /100 | #245 | Tragic 81.8% |
| Alaskan Athabascans | 0.4 /100 | #246 | Tragic 81.8% |
| Central Americans | 0.4 /100 | #247 | Tragic 81.7% |
| Puget Sound Salish | 0.3 /100 | #248 | Tragic 81.7% |
| Hmong | 0.3 /100 | #249 | Tragic 81.7% |
| Immigrants | Armenia | 0.2 /100 | #250 | Tragic 81.7% |
| Guamanians/Chamorros | 0.2 /100 | #251 | Tragic 81.6% |
| Pennsylvania Germans | 0.2 /100 | #252 | Tragic 81.6% |
| Japanese | 0.2 /100 | #253 | Tragic 81.6% |
Demographics Similar to Immigrants from Belarus by In Labor Force | Age 45-54
In terms of in labor force | age 45-54, the demographic groups most similar to Immigrants from Belarus are Mongolian (83.3%, a difference of 0.0%), Maltese (83.3%, a difference of 0.010%), Immigrants from Middle Africa (83.3%, a difference of 0.010%), Immigrants from Singapore (83.3%, a difference of 0.010%), and Albanian (83.3%, a difference of 0.010%).
| Demographics | Rating | Rank | In Labor Force | Age 45-54 |
| Argentineans | 94.9 /100 | #94 | Exceptional 83.3% |
| Immigrants | Argentina | 94.9 /100 | #95 | Exceptional 83.3% |
| Immigrants | Kuwait | 94.8 /100 | #96 | Exceptional 83.3% |
| Palestinians | 94.8 /100 | #97 | Exceptional 83.3% |
| Maltese | 94.4 /100 | #98 | Exceptional 83.3% |
| Immigrants | Middle Africa | 94.3 /100 | #99 | Exceptional 83.3% |
| Mongolians | 94.2 /100 | #100 | Exceptional 83.3% |
| Immigrants | Belarus | 94.1 /100 | #101 | Exceptional 83.3% |
| Immigrants | Singapore | 93.9 /100 | #102 | Exceptional 83.3% |
| Albanians | 93.9 /100 | #103 | Exceptional 83.3% |
| Immigrants | Romania | 93.8 /100 | #104 | Exceptional 83.3% |
| Immigrants | South America | 93.5 /100 | #105 | Exceptional 83.2% |
| Sri Lankans | 93.2 /100 | #106 | Exceptional 83.2% |
| Iranians | 92.9 /100 | #107 | Exceptional 83.2% |
| Slovaks | 92.8 /100 | #108 | Exceptional 83.2% |