Alaskan Athabascan vs Immigrants from Caribbean 5th Grade
COMPARE
Alaskan Athabascan
Immigrants from Caribbean
5th Grade
5th Grade Comparison
Alaskan Athabascans
Immigrants from Caribbean
98.3%
5TH GRADE
100.0/ 100
METRIC RATING
11th/ 347
METRIC RANK
96.0%
5TH GRADE
0.0/ 100
METRIC RATING
307th/ 347
METRIC RANK
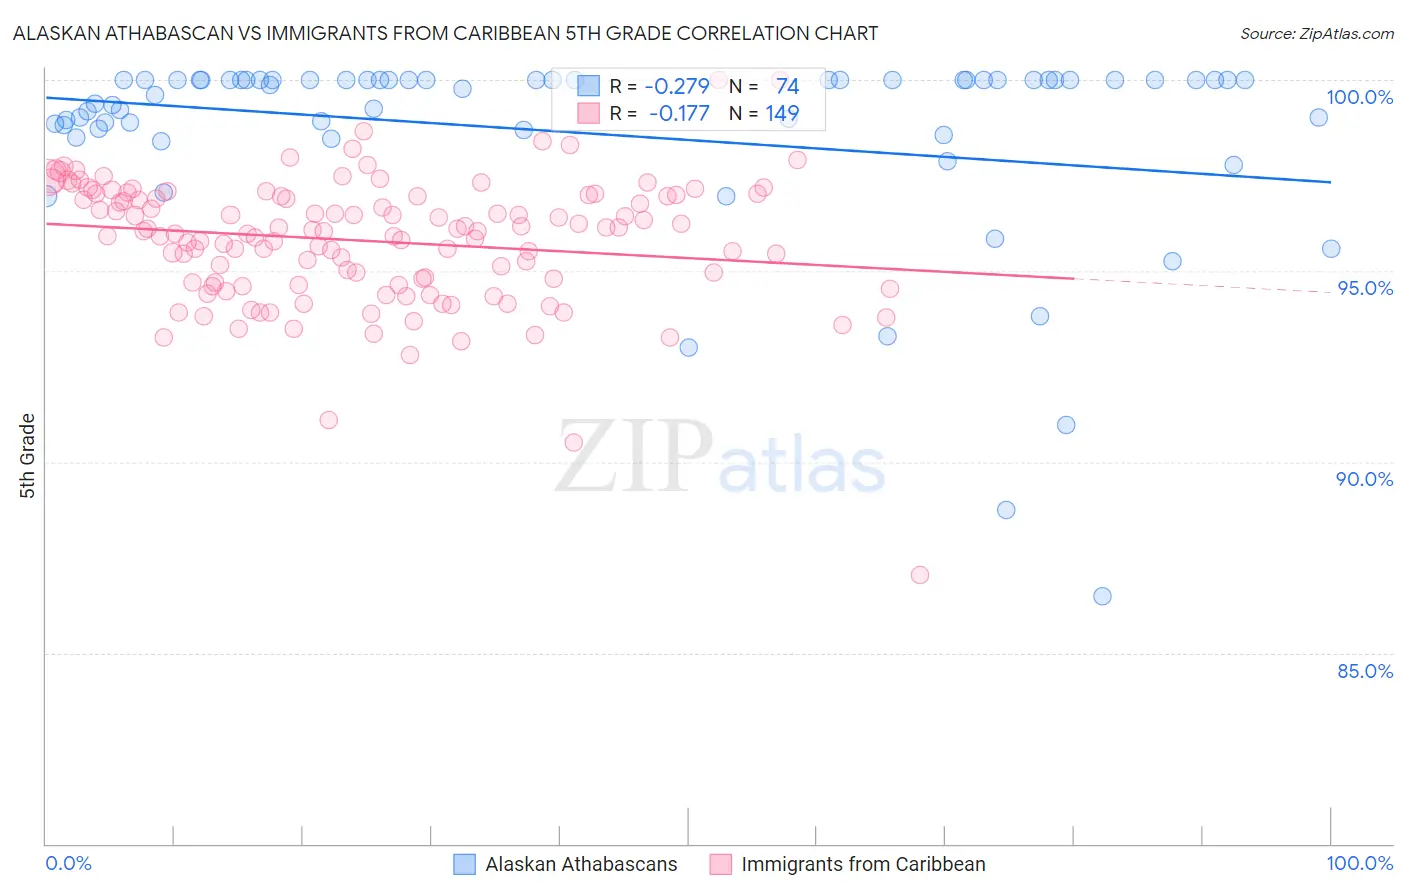
Alaskan Athabascan vs Immigrants from Caribbean 5th Grade Correlation Chart
The statistical analysis conducted on geographies consisting of 45,820,365 people shows a weak negative correlation between the proportion of Alaskan Athabascans and percentage of population with at least 5th grade education in the United States with a correlation coefficient (R) of -0.279 and weighted average of 98.3%. Similarly, the statistical analysis conducted on geographies consisting of 450,065,262 people shows a poor negative correlation between the proportion of Immigrants from Caribbean and percentage of population with at least 5th grade education in the United States with a correlation coefficient (R) of -0.177 and weighted average of 96.0%, a difference of 2.4%.
5th Grade Correlation Summary
| Measurement | Alaskan Athabascan | Immigrants from Caribbean |
| Minimum | 86.5% | 87.0% |
| Maximum | 100.0% | 100.0% |
| Range | 13.5% | 13.0% |
| Mean | 98.6% | 95.8% |
| Median | 99.9% | 96.0% |
| Interquartile 25% (IQ1) | 98.7% | 94.7% |
| Interquartile 75% (IQ3) | 100.0% | 97.0% |
| Interquartile Range (IQR) | 1.3% | 2.3% |
| Standard Deviation (Sample) | 2.6% | 1.7% |
| Standard Deviation (Population) | 2.6% | 1.7% |
Similar Demographics by 5th Grade
Demographics Similar to Alaskan Athabascans by 5th Grade
In terms of 5th grade, the demographic groups most similar to Alaskan Athabascans are Swedish (98.3%, a difference of 0.0%), English (98.3%, a difference of 0.0%), Carpatho Rusyn (98.3%, a difference of 0.010%), Tlingit-Haida (98.3%, a difference of 0.020%), and Dutch (98.3%, a difference of 0.030%).
| Demographics | Rating | Rank | 5th Grade |
| Tsimshian | 100.0 /100 | #4 | Exceptional 98.4% |
| Slovaks | 100.0 /100 | #5 | Exceptional 98.4% |
| Germans | 100.0 /100 | #6 | Exceptional 98.4% |
| Inupiat | 100.0 /100 | #7 | Exceptional 98.4% |
| Slovenes | 100.0 /100 | #8 | Exceptional 98.3% |
| Swedes | 100.0 /100 | #9 | Exceptional 98.3% |
| English | 100.0 /100 | #10 | Exceptional 98.3% |
| Alaskan Athabascans | 100.0 /100 | #11 | Exceptional 98.3% |
| Carpatho Rusyns | 100.0 /100 | #12 | Exceptional 98.3% |
| Tlingit-Haida | 100.0 /100 | #13 | Exceptional 98.3% |
| Dutch | 100.0 /100 | #14 | Exceptional 98.3% |
| Scottish | 100.0 /100 | #15 | Exceptional 98.3% |
| Poles | 100.0 /100 | #16 | Exceptional 98.3% |
| Irish | 100.0 /100 | #17 | Exceptional 98.3% |
| Pennsylvania Germans | 100.0 /100 | #18 | Exceptional 98.3% |
Demographics Similar to Immigrants from Caribbean by 5th Grade
In terms of 5th grade, the demographic groups most similar to Immigrants from Caribbean are Immigrants from Haiti (96.0%, a difference of 0.0%), Ecuadorian (96.0%, a difference of 0.010%), Immigrants from Laos (96.0%, a difference of 0.020%), Immigrants from Guyana (96.0%, a difference of 0.020%), and Immigrants from Burma/Myanmar (96.1%, a difference of 0.030%).
| Demographics | Rating | Rank | 5th Grade |
| Sri Lankans | 0.0 /100 | #300 | Tragic 96.1% |
| Immigrants | Cuba | 0.0 /100 | #301 | Tragic 96.1% |
| Guyanese | 0.0 /100 | #302 | Tragic 96.1% |
| Puerto Ricans | 0.0 /100 | #303 | Tragic 96.1% |
| Immigrants | Burma/Myanmar | 0.0 /100 | #304 | Tragic 96.1% |
| Immigrants | Laos | 0.0 /100 | #305 | Tragic 96.0% |
| Immigrants | Haiti | 0.0 /100 | #306 | Tragic 96.0% |
| Immigrants | Caribbean | 0.0 /100 | #307 | Tragic 96.0% |
| Ecuadorians | 0.0 /100 | #308 | Tragic 96.0% |
| Immigrants | Guyana | 0.0 /100 | #309 | Tragic 96.0% |
| Indonesians | 0.0 /100 | #310 | Tragic 96.0% |
| Immigrants | Bangladesh | 0.0 /100 | #311 | Tragic 96.0% |
| Vietnamese | 0.0 /100 | #312 | Tragic 95.9% |
| Bangladeshis | 0.0 /100 | #313 | Tragic 95.9% |
| Immigrants | Portugal | 0.0 /100 | #314 | Tragic 95.9% |