Navajo vs Immigrants from Caribbean In Labor Force | Age 45-54
COMPARE
Navajo
Immigrants from Caribbean
In Labor Force | Age 45-54
In Labor Force | Age 45-54 Comparison
Navajo
Immigrants from Caribbean
72.8%
IN LABOR FORCE | AGE 45-54
0.0/ 100
METRIC RATING
347th/ 347
METRIC RANK
82.1%
IN LABOR FORCE | AGE 45-54
2.5/ 100
METRIC RATING
226th/ 347
METRIC RANK
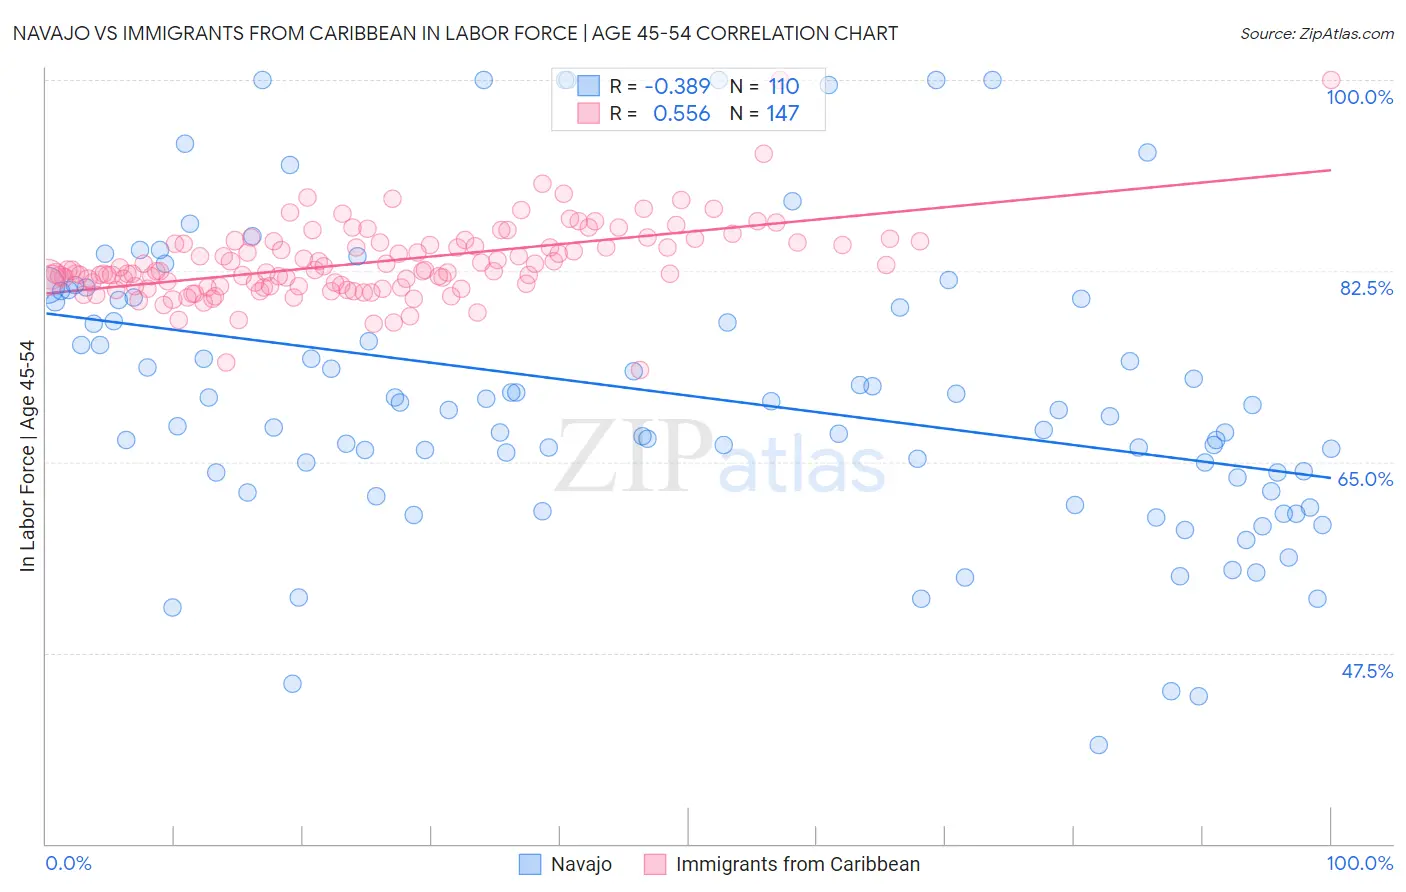
Navajo vs Immigrants from Caribbean In Labor Force | Age 45-54 Correlation Chart
The statistical analysis conducted on geographies consisting of 224,749,345 people shows a mild negative correlation between the proportion of Navajo and labor force participation rate among population between the ages 45 and 54 in the United States with a correlation coefficient (R) of -0.389 and weighted average of 72.8%. Similarly, the statistical analysis conducted on geographies consisting of 449,588,789 people shows a substantial positive correlation between the proportion of Immigrants from Caribbean and labor force participation rate among population between the ages 45 and 54 in the United States with a correlation coefficient (R) of 0.556 and weighted average of 82.1%, a difference of 12.8%.
In Labor Force | Age 45-54 Correlation Summary
| Measurement | Navajo | Immigrants from Caribbean |
| Minimum | 39.0% | 73.4% |
| Maximum | 100.0% | 100.0% |
| Range | 61.0% | 26.6% |
| Mean | 71.2% | 83.3% |
| Median | 69.7% | 82.5% |
| Interquartile 25% (IQ1) | 63.6% | 81.1% |
| Interquartile 75% (IQ3) | 79.9% | 85.1% |
| Interquartile Range (IQR) | 16.3% | 4.0% |
| Standard Deviation (Sample) | 13.3% | 3.6% |
| Standard Deviation (Population) | 13.2% | 3.5% |
Similar Demographics by In Labor Force | Age 45-54
Demographics Similar to Navajo by In Labor Force | Age 45-54
In terms of in labor force | age 45-54, the demographic groups most similar to Navajo are Pima (72.8%, a difference of 0.050%), Houma (74.1%, a difference of 1.8%), Immigrants from Yemen (74.4%, a difference of 2.2%), Hopi (75.0%, a difference of 3.0%), and Tohono O'odham (75.1%, a difference of 3.2%).
| Demographics | Rating | Rank | In Labor Force | Age 45-54 |
| Natives/Alaskans | 0.0 /100 | #333 | Tragic 77.1% |
| Apache | 0.0 /100 | #334 | Tragic 77.1% |
| Arapaho | 0.0 /100 | #335 | Tragic 77.1% |
| Paiute | 0.0 /100 | #336 | Tragic 76.7% |
| Ute | 0.0 /100 | #337 | Tragic 76.6% |
| Yuman | 0.0 /100 | #338 | Tragic 76.3% |
| Puerto Ricans | 0.0 /100 | #339 | Tragic 75.9% |
| Lumbee | 0.0 /100 | #340 | Tragic 75.6% |
| Pueblo | 0.0 /100 | #341 | Tragic 75.5% |
| Tohono O'odham | 0.0 /100 | #342 | Tragic 75.1% |
| Hopi | 0.0 /100 | #343 | Tragic 75.0% |
| Immigrants | Yemen | 0.0 /100 | #344 | Tragic 74.4% |
| Houma | 0.0 /100 | #345 | Tragic 74.1% |
| Pima | 0.0 /100 | #346 | Tragic 72.8% |
| Navajo | 0.0 /100 | #347 | Tragic 72.8% |
Demographics Similar to Immigrants from Caribbean by In Labor Force | Age 45-54
In terms of in labor force | age 45-54, the demographic groups most similar to Immigrants from Caribbean are Immigrants from Oceania (82.1%, a difference of 0.0%), Immigrants from Germany (82.1%, a difference of 0.010%), Immigrants from Jamaica (82.1%, a difference of 0.020%), Cape Verdean (82.1%, a difference of 0.040%), and Immigrants (82.1%, a difference of 0.050%).
| Demographics | Rating | Rank | In Labor Force | Age 45-54 |
| French | 4.1 /100 | #219 | Tragic 82.2% |
| Bahamians | 3.6 /100 | #220 | Tragic 82.2% |
| Panamanians | 3.5 /100 | #221 | Tragic 82.2% |
| Immigrants | Ecuador | 3.4 /100 | #222 | Tragic 82.2% |
| Immigrants | Immigrants | 3.1 /100 | #223 | Tragic 82.1% |
| Immigrants | Jamaica | 2.7 /100 | #224 | Tragic 82.1% |
| Immigrants | Oceania | 2.5 /100 | #225 | Tragic 82.1% |
| Immigrants | Caribbean | 2.5 /100 | #226 | Tragic 82.1% |
| Immigrants | Germany | 2.4 /100 | #227 | Tragic 82.1% |
| Cape Verdeans | 2.1 /100 | #228 | Tragic 82.1% |
| Immigrants | Burma/Myanmar | 1.9 /100 | #229 | Tragic 82.0% |
| Jamaicans | 1.8 /100 | #230 | Tragic 82.0% |
| Immigrants | Senegal | 1.7 /100 | #231 | Tragic 82.0% |
| Immigrants | Portugal | 1.7 /100 | #232 | Tragic 82.0% |
| Malaysians | 1.7 /100 | #233 | Tragic 82.0% |