Alaskan Athabascan vs Pakistani In Labor Force | Age 45-54
COMPARE
Alaskan Athabascan
Pakistani
In Labor Force | Age 45-54
In Labor Force | Age 45-54 Comparison
Alaskan Athabascans
Pakistanis
81.8%
IN LABOR FORCE | AGE 45-54
0.4/ 100
METRIC RATING
246th/ 347
METRIC RANK
82.8%
IN LABOR FORCE | AGE 45-54
53.2/ 100
METRIC RATING
170th/ 347
METRIC RANK
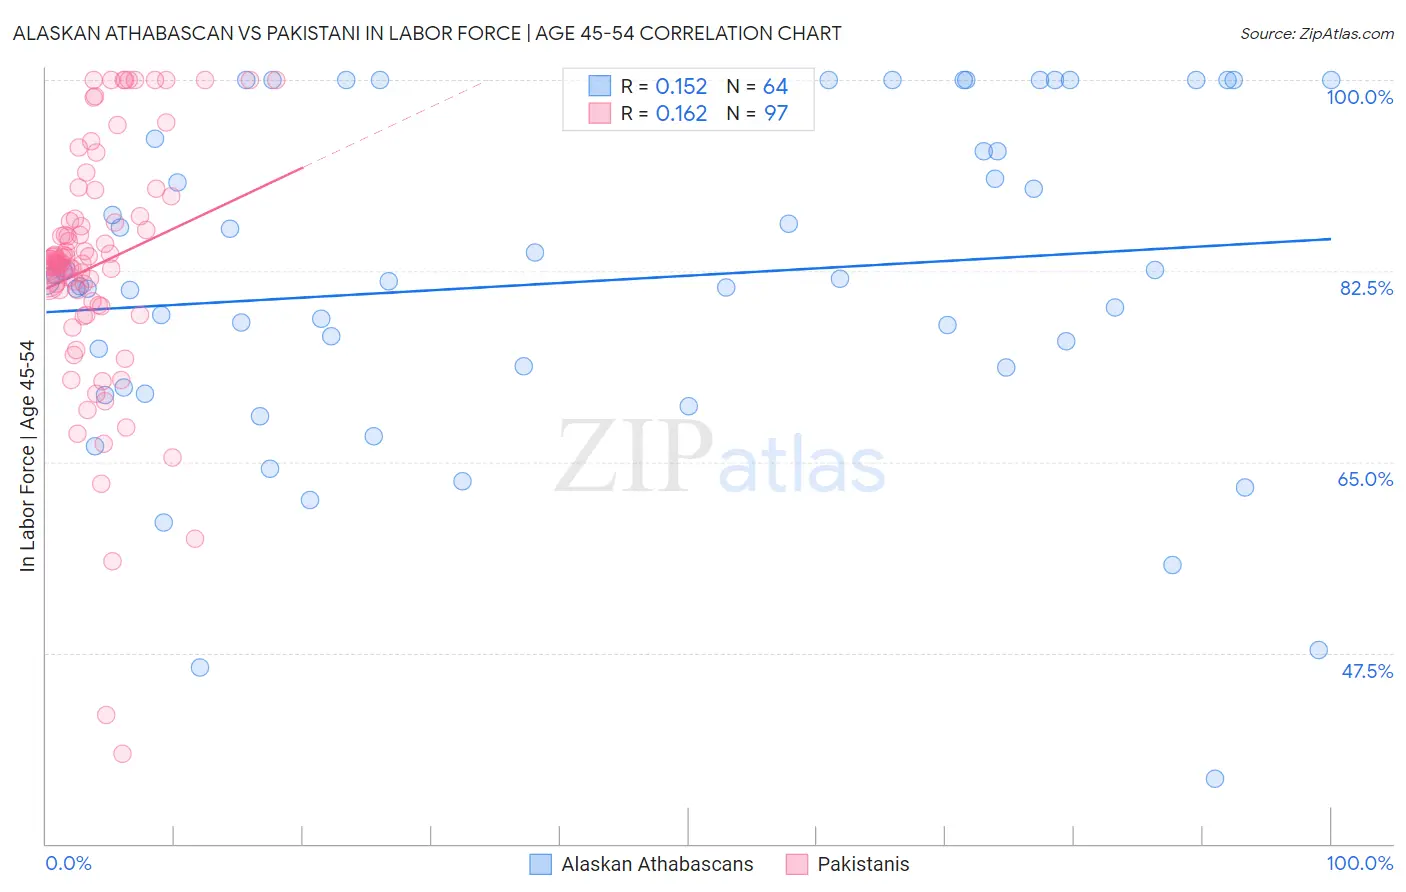
Alaskan Athabascan vs Pakistani In Labor Force | Age 45-54 Correlation Chart
The statistical analysis conducted on geographies consisting of 45,818,095 people shows a poor positive correlation between the proportion of Alaskan Athabascans and labor force participation rate among population between the ages 45 and 54 in the United States with a correlation coefficient (R) of 0.152 and weighted average of 81.8%. Similarly, the statistical analysis conducted on geographies consisting of 335,175,573 people shows a poor positive correlation between the proportion of Pakistanis and labor force participation rate among population between the ages 45 and 54 in the United States with a correlation coefficient (R) of 0.162 and weighted average of 82.8%, a difference of 1.3%.
In Labor Force | Age 45-54 Correlation Summary
| Measurement | Alaskan Athabascan | Pakistani |
| Minimum | 36.0% | 38.2% |
| Maximum | 100.0% | 100.0% |
| Range | 64.0% | 61.8% |
| Mean | 81.5% | 83.0% |
| Median | 81.5% | 83.2% |
| Interquartile 25% (IQ1) | 72.8% | 79.5% |
| Interquartile 75% (IQ3) | 94.1% | 87.4% |
| Interquartile Range (IQR) | 21.3% | 7.9% |
| Standard Deviation (Sample) | 15.0% | 11.4% |
| Standard Deviation (Population) | 14.9% | 11.3% |
Similar Demographics by In Labor Force | Age 45-54
Demographics Similar to Alaskan Athabascans by In Labor Force | Age 45-54
In terms of in labor force | age 45-54, the demographic groups most similar to Alaskan Athabascans are Alaska Native (81.8%, a difference of 0.010%), Celtic (81.8%, a difference of 0.020%), Central American (81.7%, a difference of 0.020%), Puget Sound Salish (81.7%, a difference of 0.040%), and Hmong (81.7%, a difference of 0.060%).
| Demographics | Rating | Rank | In Labor Force | Age 45-54 |
| Immigrants | Thailand | 1.0 /100 | #239 | Tragic 81.9% |
| Immigrants | El Salvador | 1.0 /100 | #240 | Tragic 81.9% |
| Immigrants | Cambodia | 0.8 /100 | #241 | Tragic 81.9% |
| Whites/Caucasians | 0.7 /100 | #242 | Tragic 81.9% |
| Samoans | 0.6 /100 | #243 | Tragic 81.8% |
| Celtics | 0.4 /100 | #244 | Tragic 81.8% |
| Alaska Natives | 0.4 /100 | #245 | Tragic 81.8% |
| Alaskan Athabascans | 0.4 /100 | #246 | Tragic 81.8% |
| Central Americans | 0.4 /100 | #247 | Tragic 81.7% |
| Puget Sound Salish | 0.3 /100 | #248 | Tragic 81.7% |
| Hmong | 0.3 /100 | #249 | Tragic 81.7% |
| Immigrants | Armenia | 0.2 /100 | #250 | Tragic 81.7% |
| Guamanians/Chamorros | 0.2 /100 | #251 | Tragic 81.6% |
| Pennsylvania Germans | 0.2 /100 | #252 | Tragic 81.6% |
| Japanese | 0.2 /100 | #253 | Tragic 81.6% |
Demographics Similar to Pakistanis by In Labor Force | Age 45-54
In terms of in labor force | age 45-54, the demographic groups most similar to Pakistanis are Immigrants from Zaire (82.8%, a difference of 0.0%), Immigrants from Western Africa (82.8%, a difference of 0.010%), Icelander (82.8%, a difference of 0.010%), Immigrants from South Africa (82.8%, a difference of 0.020%), and Swiss (82.8%, a difference of 0.030%).
| Demographics | Rating | Rank | In Labor Force | Age 45-54 |
| Dutch | 61.7 /100 | #163 | Good 82.8% |
| German Russians | 61.3 /100 | #164 | Good 82.8% |
| Immigrants | Sudan | 59.9 /100 | #165 | Average 82.8% |
| Immigrants | South Eastern Asia | 57.4 /100 | #166 | Average 82.8% |
| Swiss | 56.5 /100 | #167 | Average 82.8% |
| Immigrants | South Africa | 55.8 /100 | #168 | Average 82.8% |
| Immigrants | Western Africa | 54.1 /100 | #169 | Average 82.8% |
| Pakistanis | 53.2 /100 | #170 | Average 82.8% |
| Immigrants | Zaire | 52.9 /100 | #171 | Average 82.8% |
| Icelanders | 51.8 /100 | #172 | Average 82.8% |
| Nicaraguans | 50.3 /100 | #173 | Average 82.8% |
| Costa Ricans | 50.0 /100 | #174 | Average 82.8% |
| Immigrants | Liberia | 47.9 /100 | #175 | Average 82.7% |
| Northern Europeans | 46.9 /100 | #176 | Average 82.7% |
| Immigrants | Nicaragua | 44.6 /100 | #177 | Average 82.7% |