Alaskan Athabascan vs Immigrants from Costa Rica In Labor Force | Age 45-54
COMPARE
Alaskan Athabascan
Immigrants from Costa Rica
In Labor Force | Age 45-54
In Labor Force | Age 45-54 Comparison
Alaskan Athabascans
Immigrants from Costa Rica
81.8%
IN LABOR FORCE | AGE 45-54
0.4/ 100
METRIC RATING
246th/ 347
METRIC RANK
82.6%
IN LABOR FORCE | AGE 45-54
28.3/ 100
METRIC RATING
187th/ 347
METRIC RANK
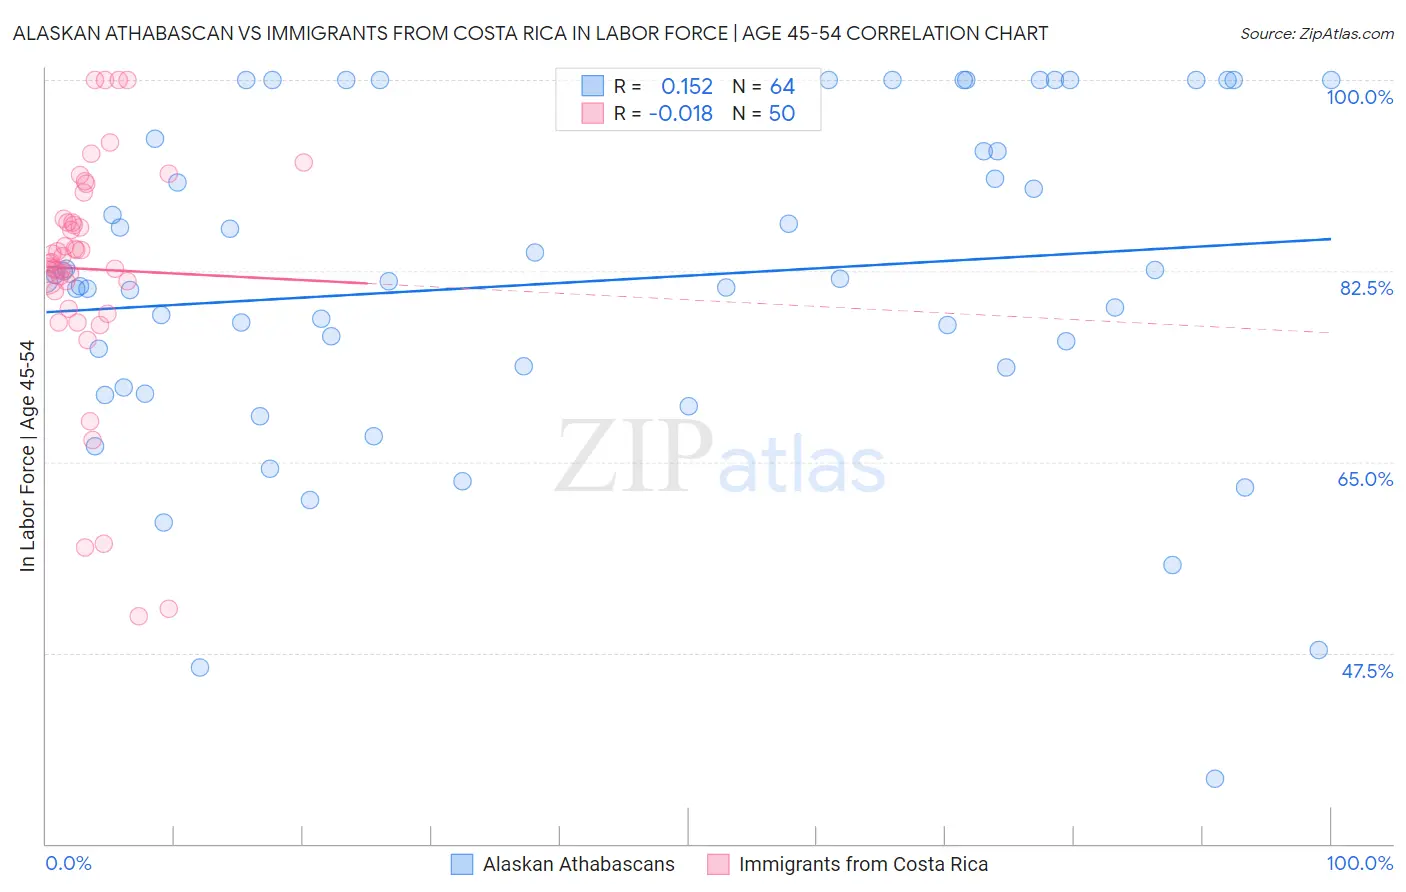
Alaskan Athabascan vs Immigrants from Costa Rica In Labor Force | Age 45-54 Correlation Chart
The statistical analysis conducted on geographies consisting of 45,818,095 people shows a poor positive correlation between the proportion of Alaskan Athabascans and labor force participation rate among population between the ages 45 and 54 in the United States with a correlation coefficient (R) of 0.152 and weighted average of 81.8%. Similarly, the statistical analysis conducted on geographies consisting of 204,239,151 people shows no correlation between the proportion of Immigrants from Costa Rica and labor force participation rate among population between the ages 45 and 54 in the United States with a correlation coefficient (R) of -0.018 and weighted average of 82.6%, a difference of 1.0%.
In Labor Force | Age 45-54 Correlation Summary
| Measurement | Alaskan Athabascan | Immigrants from Costa Rica |
| Minimum | 36.0% | 50.8% |
| Maximum | 100.0% | 100.0% |
| Range | 64.0% | 49.2% |
| Mean | 81.5% | 82.7% |
| Median | 81.5% | 83.5% |
| Interquartile 25% (IQ1) | 72.8% | 80.6% |
| Interquartile 75% (IQ3) | 94.1% | 87.2% |
| Interquartile Range (IQR) | 21.3% | 6.6% |
| Standard Deviation (Sample) | 15.0% | 10.9% |
| Standard Deviation (Population) | 14.9% | 10.8% |
Similar Demographics by In Labor Force | Age 45-54
Demographics Similar to Alaskan Athabascans by In Labor Force | Age 45-54
In terms of in labor force | age 45-54, the demographic groups most similar to Alaskan Athabascans are Alaska Native (81.8%, a difference of 0.010%), Celtic (81.8%, a difference of 0.020%), Central American (81.7%, a difference of 0.020%), Puget Sound Salish (81.7%, a difference of 0.040%), and Hmong (81.7%, a difference of 0.060%).
| Demographics | Rating | Rank | In Labor Force | Age 45-54 |
| Immigrants | Thailand | 1.0 /100 | #239 | Tragic 81.9% |
| Immigrants | El Salvador | 1.0 /100 | #240 | Tragic 81.9% |
| Immigrants | Cambodia | 0.8 /100 | #241 | Tragic 81.9% |
| Whites/Caucasians | 0.7 /100 | #242 | Tragic 81.9% |
| Samoans | 0.6 /100 | #243 | Tragic 81.8% |
| Celtics | 0.4 /100 | #244 | Tragic 81.8% |
| Alaska Natives | 0.4 /100 | #245 | Tragic 81.8% |
| Alaskan Athabascans | 0.4 /100 | #246 | Tragic 81.8% |
| Central Americans | 0.4 /100 | #247 | Tragic 81.7% |
| Puget Sound Salish | 0.3 /100 | #248 | Tragic 81.7% |
| Hmong | 0.3 /100 | #249 | Tragic 81.7% |
| Immigrants | Armenia | 0.2 /100 | #250 | Tragic 81.7% |
| Guamanians/Chamorros | 0.2 /100 | #251 | Tragic 81.6% |
| Pennsylvania Germans | 0.2 /100 | #252 | Tragic 81.6% |
| Japanese | 0.2 /100 | #253 | Tragic 81.6% |
Demographics Similar to Immigrants from Costa Rica by In Labor Force | Age 45-54
In terms of in labor force | age 45-54, the demographic groups most similar to Immigrants from Costa Rica are South African (82.6%, a difference of 0.0%), Irish (82.6%, a difference of 0.010%), Syrian (82.6%, a difference of 0.030%), British (82.6%, a difference of 0.030%), and Immigrants from England (82.6%, a difference of 0.040%).
| Demographics | Rating | Rank | In Labor Force | Age 45-54 |
| Hungarians | 38.0 /100 | #180 | Fair 82.7% |
| Israelis | 37.7 /100 | #181 | Fair 82.7% |
| Immigrants | Hungary | 37.1 /100 | #182 | Fair 82.7% |
| New Zealanders | 32.7 /100 | #183 | Fair 82.6% |
| Europeans | 32.6 /100 | #184 | Fair 82.6% |
| Immigrants | England | 32.2 /100 | #185 | Fair 82.6% |
| Irish | 29.2 /100 | #186 | Fair 82.6% |
| Immigrants | Costa Rica | 28.3 /100 | #187 | Fair 82.6% |
| South Africans | 28.0 /100 | #188 | Fair 82.6% |
| Syrians | 26.0 /100 | #189 | Fair 82.6% |
| British | 25.7 /100 | #190 | Fair 82.6% |
| Armenians | 23.2 /100 | #191 | Fair 82.5% |
| Immigrants | Iraq | 20.9 /100 | #192 | Fair 82.5% |
| Australians | 20.8 /100 | #193 | Fair 82.5% |
| Immigrants | Norway | 20.7 /100 | #194 | Fair 82.5% |