Swedish vs Estonian In Labor Force | Age 35-44
COMPARE
Swedish
Estonian
In Labor Force | Age 35-44
In Labor Force | Age 35-44 Comparison
Swedes
Estonians
85.0%
IN LABOR FORCE | AGE 35-44
99.2/ 100
METRIC RATING
64th/ 347
METRIC RANK
85.3%
IN LABOR FORCE | AGE 35-44
99.9/ 100
METRIC RATING
35th/ 347
METRIC RANK
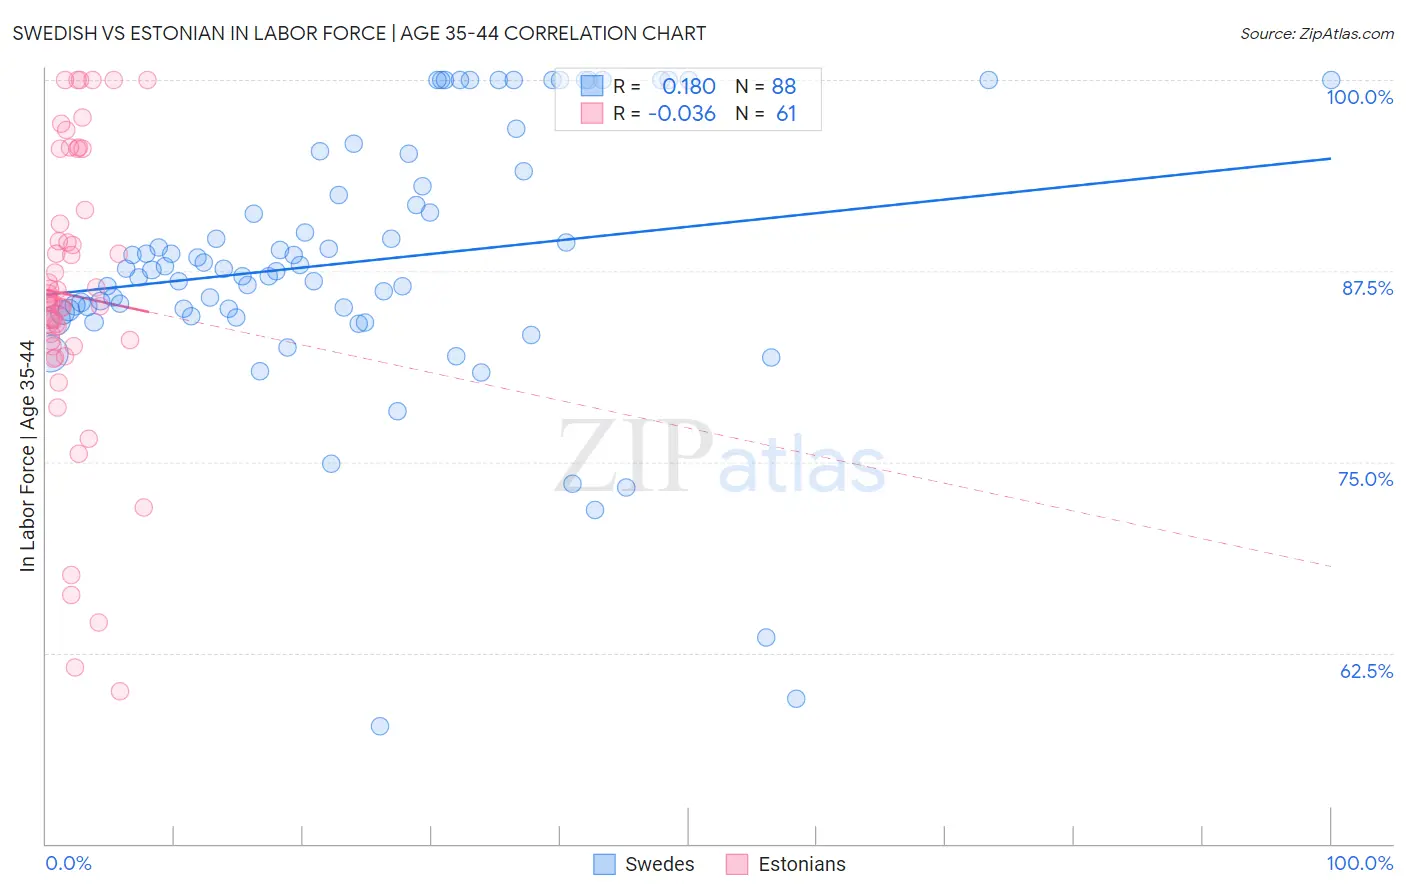
Swedish vs Estonian In Labor Force | Age 35-44 Correlation Chart
The statistical analysis conducted on geographies consisting of 538,724,566 people shows a poor positive correlation between the proportion of Swedes and labor force participation rate among population between the ages 35 and 44 in the United States with a correlation coefficient (R) of 0.180 and weighted average of 85.0%. Similarly, the statistical analysis conducted on geographies consisting of 123,503,374 people shows no correlation between the proportion of Estonians and labor force participation rate among population between the ages 35 and 44 in the United States with a correlation coefficient (R) of -0.036 and weighted average of 85.3%, a difference of 0.28%.
In Labor Force | Age 35-44 Correlation Summary
| Measurement | Swedish | Estonian |
| Minimum | 57.7% | 60.0% |
| Maximum | 100.0% | 100.0% |
| Range | 42.3% | 40.0% |
| Mean | 88.1% | 85.9% |
| Median | 87.6% | 85.5% |
| Interquartile 25% (IQ1) | 84.9% | 82.7% |
| Interquartile 75% (IQ3) | 93.5% | 91.1% |
| Interquartile Range (IQR) | 8.6% | 8.3% |
| Standard Deviation (Sample) | 8.7% | 9.3% |
| Standard Deviation (Population) | 8.6% | 9.2% |
Similar Demographics by In Labor Force | Age 35-44
Demographics Similar to Swedes by In Labor Force | Age 35-44
In terms of in labor force | age 35-44, the demographic groups most similar to Swedes are Immigrants from Moldova (85.0%, a difference of 0.010%), Immigrants from Uganda (85.0%, a difference of 0.010%), Immigrants from Brazil (85.0%, a difference of 0.010%), Immigrants from Latvia (85.0%, a difference of 0.020%), and Immigrants from Haiti (85.0%, a difference of 0.020%).
| Demographics | Rating | Rank | In Labor Force | Age 35-44 |
| Chinese | 99.4 /100 | #57 | Exceptional 85.1% |
| Slovaks | 99.4 /100 | #58 | Exceptional 85.1% |
| Serbians | 99.4 /100 | #59 | Exceptional 85.1% |
| Albanians | 99.4 /100 | #60 | Exceptional 85.1% |
| Immigrants | Latvia | 99.3 /100 | #61 | Exceptional 85.0% |
| Immigrants | Moldova | 99.3 /100 | #62 | Exceptional 85.0% |
| Immigrants | Uganda | 99.3 /100 | #63 | Exceptional 85.0% |
| Swedes | 99.2 /100 | #64 | Exceptional 85.0% |
| Immigrants | Brazil | 99.2 /100 | #65 | Exceptional 85.0% |
| Immigrants | Haiti | 99.1 /100 | #66 | Exceptional 85.0% |
| Immigrants | Italy | 99.1 /100 | #67 | Exceptional 85.0% |
| Italians | 99.1 /100 | #68 | Exceptional 85.0% |
| Sudanese | 99.0 /100 | #69 | Exceptional 85.0% |
| Brazilians | 99.0 /100 | #70 | Exceptional 85.0% |
| Russians | 99.0 /100 | #71 | Exceptional 85.0% |
Demographics Similar to Estonians by In Labor Force | Age 35-44
In terms of in labor force | age 35-44, the demographic groups most similar to Estonians are Immigrants from Nepal (85.3%, a difference of 0.0%), Ugandan (85.3%, a difference of 0.030%), Immigrants from Morocco (85.2%, a difference of 0.030%), Bermudan (85.3%, a difference of 0.040%), and Czech (85.3%, a difference of 0.040%).
| Demographics | Rating | Rank | In Labor Force | Age 35-44 |
| Immigrants | Greece | 99.9 /100 | #28 | Exceptional 85.3% |
| Cambodians | 99.9 /100 | #29 | Exceptional 85.3% |
| Bermudans | 99.9 /100 | #30 | Exceptional 85.3% |
| Czechs | 99.9 /100 | #31 | Exceptional 85.3% |
| Immigrants | India | 99.9 /100 | #32 | Exceptional 85.3% |
| Ugandans | 99.9 /100 | #33 | Exceptional 85.3% |
| Immigrants | Nepal | 99.9 /100 | #34 | Exceptional 85.3% |
| Estonians | 99.9 /100 | #35 | Exceptional 85.3% |
| Immigrants | Morocco | 99.8 /100 | #36 | Exceptional 85.2% |
| Kenyans | 99.8 /100 | #37 | Exceptional 85.2% |
| Immigrants | Poland | 99.8 /100 | #38 | Exceptional 85.2% |
| Eastern Europeans | 99.8 /100 | #39 | Exceptional 85.2% |
| Immigrants | Bulgaria | 99.8 /100 | #40 | Exceptional 85.2% |
| Immigrants | Zimbabwe | 99.8 /100 | #41 | Exceptional 85.2% |
| Macedonians | 99.8 /100 | #42 | Exceptional 85.2% |