Northern European vs Estonian In Labor Force | Age 35-44
COMPARE
Northern European
Estonian
In Labor Force | Age 35-44
In Labor Force | Age 35-44 Comparison
Northern Europeans
Estonians
84.3%
IN LABOR FORCE | AGE 35-44
44.1/ 100
METRIC RATING
178th/ 347
METRIC RANK
85.3%
IN LABOR FORCE | AGE 35-44
99.9/ 100
METRIC RATING
35th/ 347
METRIC RANK
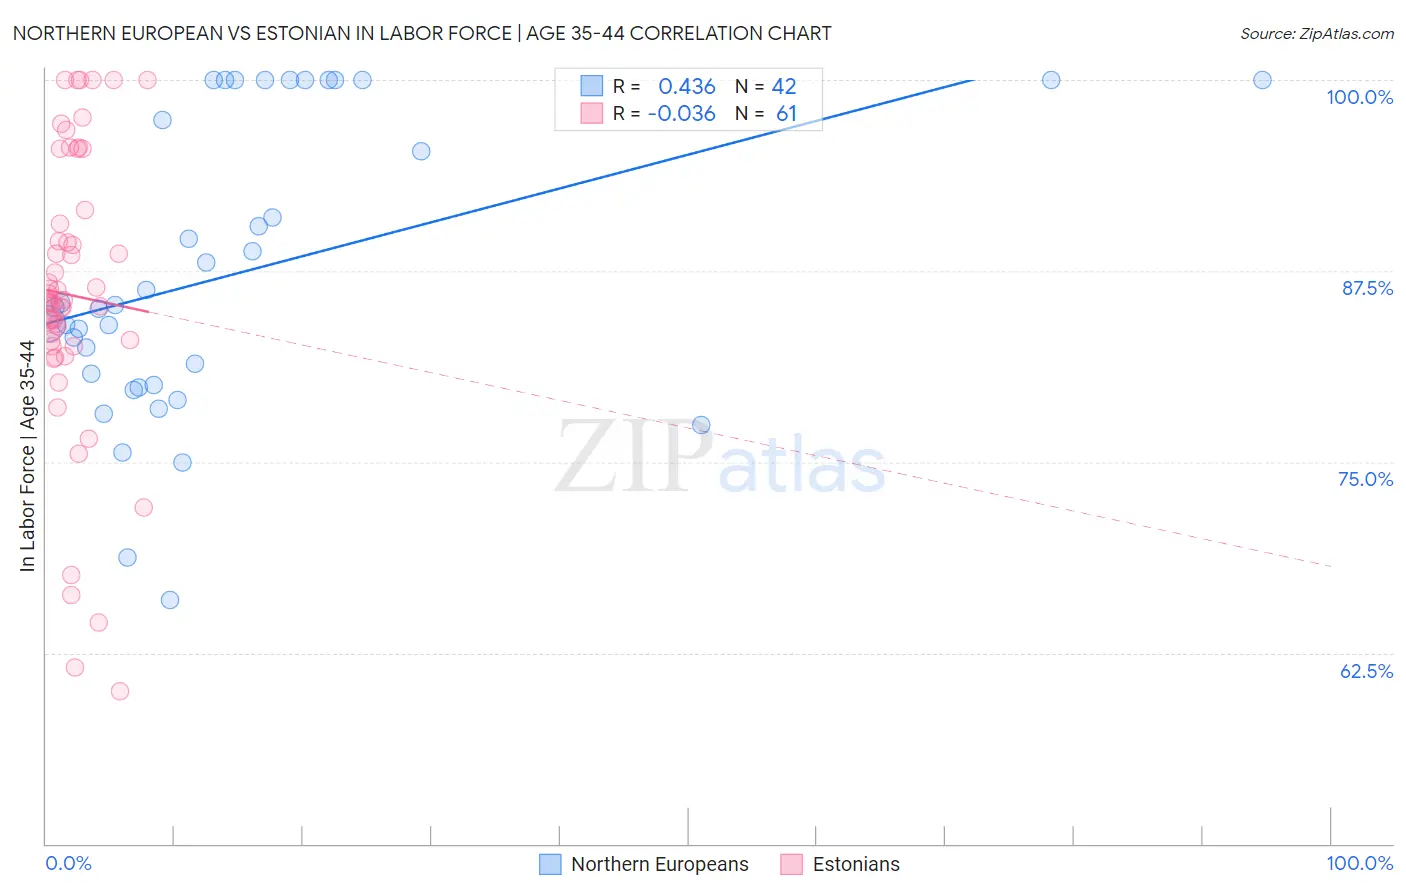
Northern European vs Estonian In Labor Force | Age 35-44 Correlation Chart
The statistical analysis conducted on geographies consisting of 405,956,669 people shows a moderate positive correlation between the proportion of Northern Europeans and labor force participation rate among population between the ages 35 and 44 in the United States with a correlation coefficient (R) of 0.436 and weighted average of 84.3%. Similarly, the statistical analysis conducted on geographies consisting of 123,503,374 people shows no correlation between the proportion of Estonians and labor force participation rate among population between the ages 35 and 44 in the United States with a correlation coefficient (R) of -0.036 and weighted average of 85.3%, a difference of 1.1%.
In Labor Force | Age 35-44 Correlation Summary
| Measurement | Northern European | Estonian |
| Minimum | 66.0% | 60.0% |
| Maximum | 100.0% | 100.0% |
| Range | 34.0% | 40.0% |
| Mean | 87.4% | 85.9% |
| Median | 85.2% | 85.5% |
| Interquartile 25% (IQ1) | 80.1% | 82.7% |
| Interquartile 75% (IQ3) | 100.0% | 91.1% |
| Interquartile Range (IQR) | 19.9% | 8.3% |
| Standard Deviation (Sample) | 9.5% | 9.3% |
| Standard Deviation (Population) | 9.4% | 9.2% |
Similar Demographics by In Labor Force | Age 35-44
Demographics Similar to Northern Europeans by In Labor Force | Age 35-44
In terms of in labor force | age 35-44, the demographic groups most similar to Northern Europeans are French Canadian (84.3%, a difference of 0.0%), Immigrants from South Africa (84.3%, a difference of 0.010%), Sri Lankan (84.4%, a difference of 0.020%), Pakistani (84.4%, a difference of 0.030%), and Immigrants from Trinidad and Tobago (84.4%, a difference of 0.040%).
| Demographics | Rating | Rank | In Labor Force | Age 35-44 |
| Jordanians | 51.7 /100 | #171 | Average 84.4% |
| Scandinavians | 51.2 /100 | #172 | Average 84.4% |
| Immigrants | Trinidad and Tobago | 50.7 /100 | #173 | Average 84.4% |
| Immigrants | Iran | 50.0 /100 | #174 | Average 84.4% |
| Pakistanis | 48.2 /100 | #175 | Average 84.4% |
| Sri Lankans | 47.3 /100 | #176 | Average 84.4% |
| French Canadians | 44.3 /100 | #177 | Average 84.3% |
| Northern Europeans | 44.1 /100 | #178 | Average 84.3% |
| Immigrants | South Africa | 42.8 /100 | #179 | Average 84.3% |
| Danes | 38.8 /100 | #180 | Fair 84.3% |
| Immigrants | West Indies | 36.4 /100 | #181 | Fair 84.3% |
| Koreans | 36.3 /100 | #182 | Fair 84.3% |
| Barbadians | 36.2 /100 | #183 | Fair 84.3% |
| Armenians | 35.6 /100 | #184 | Fair 84.3% |
| Costa Ricans | 35.3 /100 | #185 | Fair 84.3% |
Demographics Similar to Estonians by In Labor Force | Age 35-44
In terms of in labor force | age 35-44, the demographic groups most similar to Estonians are Immigrants from Nepal (85.3%, a difference of 0.0%), Ugandan (85.3%, a difference of 0.030%), Immigrants from Morocco (85.2%, a difference of 0.030%), Bermudan (85.3%, a difference of 0.040%), and Czech (85.3%, a difference of 0.040%).
| Demographics | Rating | Rank | In Labor Force | Age 35-44 |
| Immigrants | Greece | 99.9 /100 | #28 | Exceptional 85.3% |
| Cambodians | 99.9 /100 | #29 | Exceptional 85.3% |
| Bermudans | 99.9 /100 | #30 | Exceptional 85.3% |
| Czechs | 99.9 /100 | #31 | Exceptional 85.3% |
| Immigrants | India | 99.9 /100 | #32 | Exceptional 85.3% |
| Ugandans | 99.9 /100 | #33 | Exceptional 85.3% |
| Immigrants | Nepal | 99.9 /100 | #34 | Exceptional 85.3% |
| Estonians | 99.9 /100 | #35 | Exceptional 85.3% |
| Immigrants | Morocco | 99.8 /100 | #36 | Exceptional 85.2% |
| Kenyans | 99.8 /100 | #37 | Exceptional 85.2% |
| Immigrants | Poland | 99.8 /100 | #38 | Exceptional 85.2% |
| Eastern Europeans | 99.8 /100 | #39 | Exceptional 85.2% |
| Immigrants | Bulgaria | 99.8 /100 | #40 | Exceptional 85.2% |
| Immigrants | Zimbabwe | 99.8 /100 | #41 | Exceptional 85.2% |
| Macedonians | 99.8 /100 | #42 | Exceptional 85.2% |