Alaskan Athabascan vs Estonian Median Household Income
COMPARE
Alaskan Athabascan
Estonian
Median Household Income
Median Household Income Comparison
Alaskan Athabascans
Estonians
$76,383
MEDIAN HOUSEHOLD INCOME
0.4/ 100
METRIC RATING
263rd/ 347
METRIC RANK
$95,930
MEDIAN HOUSEHOLD INCOME
99.9/ 100
METRIC RATING
51st/ 347
METRIC RANK
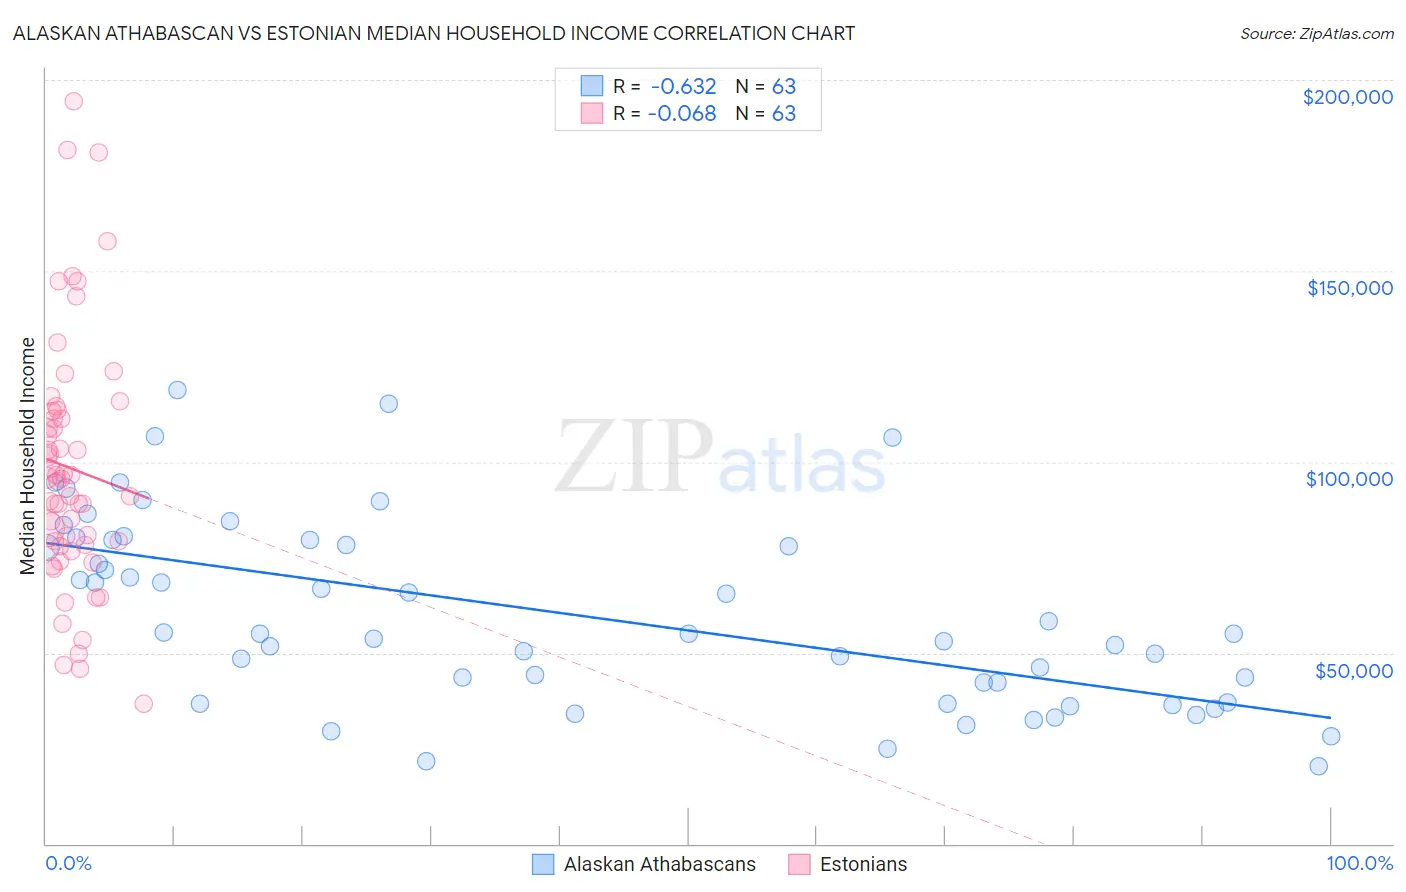
Alaskan Athabascan vs Estonian Median Household Income Correlation Chart
The statistical analysis conducted on geographies consisting of 45,812,420 people shows a significant negative correlation between the proportion of Alaskan Athabascans and median household income in the United States with a correlation coefficient (R) of -0.632 and weighted average of $76,383. Similarly, the statistical analysis conducted on geographies consisting of 123,471,102 people shows a slight negative correlation between the proportion of Estonians and median household income in the United States with a correlation coefficient (R) of -0.068 and weighted average of $95,930, a difference of 25.6%.
Median Household Income Correlation Summary
| Measurement | Alaskan Athabascan | Estonian |
| Minimum | $20,417 | $36,563 |
| Maximum | $118,934 | $194,375 |
| Range | $98,517 | $157,812 |
| Mean | $60,171 | $98,343 |
| Median | $55,000 | $95,522 |
| Interquartile 25% (IQ1) | $36,964 | $78,091 |
| Interquartile 75% (IQ3) | $79,438 | $113,403 |
| Interquartile Range (IQR) | $42,474 | $35,312 |
| Standard Deviation (Sample) | $24,397 | $32,504 |
| Standard Deviation (Population) | $24,203 | $32,245 |
Similar Demographics by Median Household Income
Demographics Similar to Alaskan Athabascans by Median Household Income
In terms of median household income, the demographic groups most similar to Alaskan Athabascans are French American Indian ($76,387, a difference of 0.010%), Immigrants from Grenada ($76,517, a difference of 0.18%), Jamaican ($76,583, a difference of 0.26%), Spanish American Indian ($76,670, a difference of 0.38%), and Immigrants from Nicaragua ($76,784, a difference of 0.52%).
| Demographics | Rating | Rank | Median Household Income |
| Belizeans | 0.6 /100 | #256 | Tragic $77,028 |
| Immigrants | Senegal | 0.5 /100 | #257 | Tragic $76,915 |
| Immigrants | Nicaragua | 0.5 /100 | #258 | Tragic $76,784 |
| Spanish American Indians | 0.4 /100 | #259 | Tragic $76,670 |
| Jamaicans | 0.4 /100 | #260 | Tragic $76,583 |
| Immigrants | Grenada | 0.4 /100 | #261 | Tragic $76,517 |
| French American Indians | 0.4 /100 | #262 | Tragic $76,387 |
| Alaskan Athabascans | 0.4 /100 | #263 | Tragic $76,383 |
| Guatemalans | 0.3 /100 | #264 | Tragic $75,961 |
| Immigrants | Belize | 0.3 /100 | #265 | Tragic $75,938 |
| Americans | 0.3 /100 | #266 | Tragic $75,932 |
| German Russians | 0.3 /100 | #267 | Tragic $75,856 |
| Immigrants | Jamaica | 0.3 /100 | #268 | Tragic $75,851 |
| Cape Verdeans | 0.3 /100 | #269 | Tragic $75,848 |
| Hmong | 0.3 /100 | #270 | Tragic $75,839 |
Demographics Similar to Estonians by Median Household Income
In terms of median household income, the demographic groups most similar to Estonians are Immigrants from South Africa ($95,800, a difference of 0.14%), Paraguayan ($95,737, a difference of 0.20%), Egyptian ($95,673, a difference of 0.27%), Immigrants from Malaysia ($96,292, a difference of 0.38%), and Bulgarian ($96,290, a difference of 0.38%).
| Demographics | Rating | Rank | Median Household Income |
| Immigrants | Greece | 99.9 /100 | #44 | Exceptional $96,675 |
| Israelis | 99.9 /100 | #45 | Exceptional $96,552 |
| Australians | 99.9 /100 | #46 | Exceptional $96,490 |
| Immigrants | Russia | 99.9 /100 | #47 | Exceptional $96,378 |
| Cambodians | 99.9 /100 | #48 | Exceptional $96,324 |
| Immigrants | Malaysia | 99.9 /100 | #49 | Exceptional $96,292 |
| Bulgarians | 99.9 /100 | #50 | Exceptional $96,290 |
| Estonians | 99.9 /100 | #51 | Exceptional $95,930 |
| Immigrants | South Africa | 99.9 /100 | #52 | Exceptional $95,800 |
| Paraguayans | 99.9 /100 | #53 | Exceptional $95,737 |
| Egyptians | 99.9 /100 | #54 | Exceptional $95,673 |
| Immigrants | Czechoslovakia | 99.9 /100 | #55 | Exceptional $95,319 |
| Immigrants | Austria | 99.9 /100 | #56 | Exceptional $95,277 |
| New Zealanders | 99.8 /100 | #57 | Exceptional $95,146 |
| Soviet Union | 99.8 /100 | #58 | Exceptional $95,098 |