Zimbabwean vs White/Caucasian Median Family Income
COMPARE
Zimbabwean
White/Caucasian
Median Family Income
Median Family Income Comparison
Zimbabweans
Whites/Caucasians
$110,011
MEDIAN FAMILY INCOME
97.7/ 100
METRIC RATING
95th/ 347
METRIC RANK
$99,800
MEDIAN FAMILY INCOME
18.7/ 100
METRIC RATING
202nd/ 347
METRIC RANK
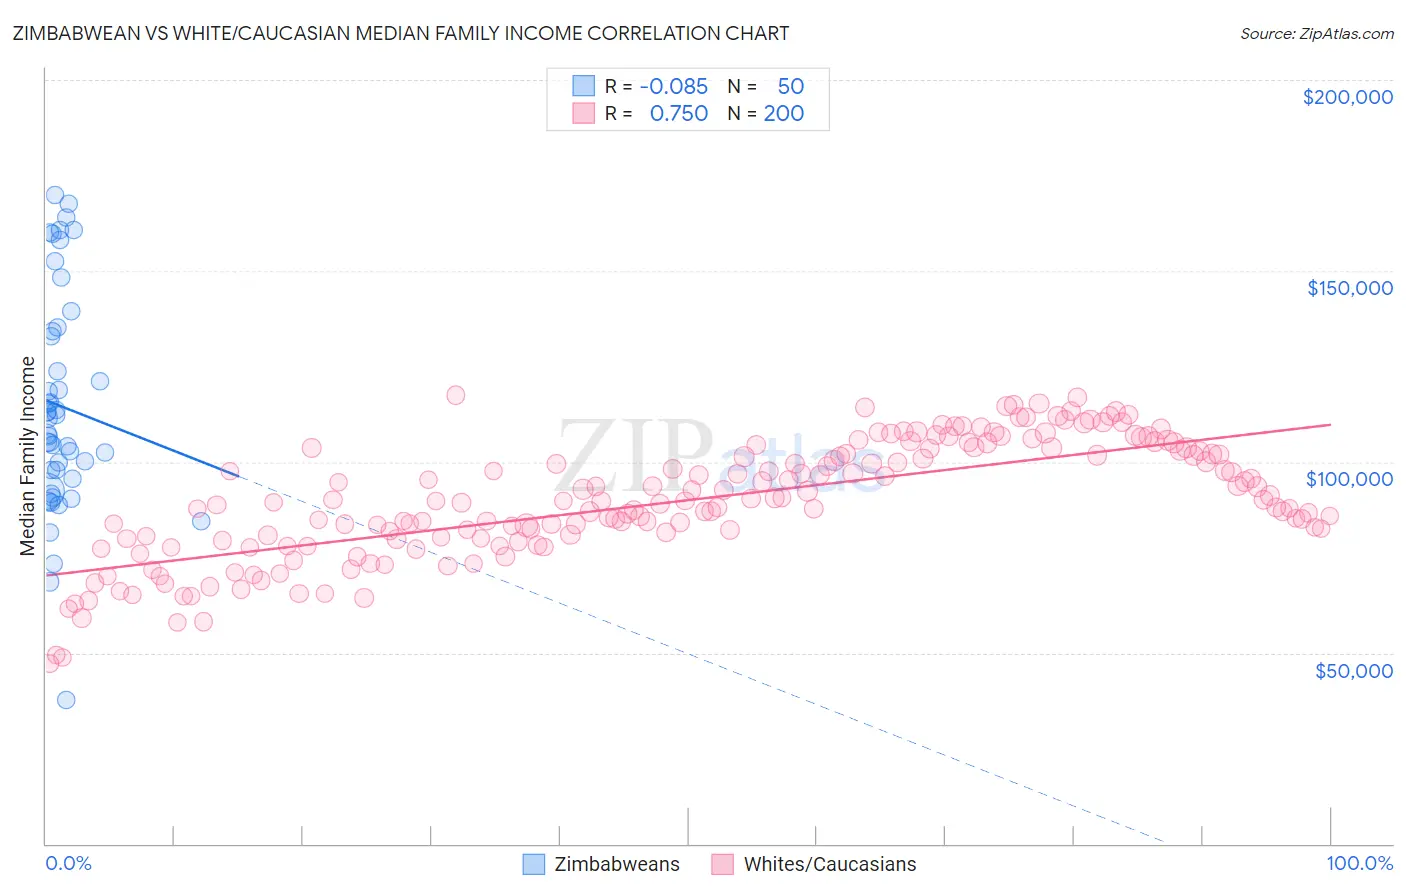
Zimbabwean vs White/Caucasian Median Family Income Correlation Chart
The statistical analysis conducted on geographies consisting of 69,185,684 people shows a slight negative correlation between the proportion of Zimbabweans and median family income in the United States with a correlation coefficient (R) of -0.085 and weighted average of $110,011. Similarly, the statistical analysis conducted on geographies consisting of 582,814,142 people shows a strong positive correlation between the proportion of Whites/Caucasians and median family income in the United States with a correlation coefficient (R) of 0.750 and weighted average of $99,800, a difference of 10.2%.
Median Family Income Correlation Summary
| Measurement | Zimbabwean | White/Caucasian |
| Minimum | $37,500 | $47,087 |
| Maximum | $169,922 | $117,539 |
| Range | $132,422 | $70,452 |
| Mean | $114,541 | $89,997 |
| Median | $109,407 | $89,813 |
| Interquartile 25% (IQ1) | $95,466 | $80,036 |
| Interquartile 75% (IQ3) | $134,100 | $102,904 |
| Interquartile Range (IQR) | $38,634 | $22,868 |
| Standard Deviation (Sample) | $28,953 | $15,237 |
| Standard Deviation (Population) | $28,662 | $15,199 |
Similar Demographics by Median Family Income
Demographics Similar to Zimbabweans by Median Family Income
In terms of median family income, the demographic groups most similar to Zimbabweans are Immigrants from Moldova ($109,975, a difference of 0.030%), Korean ($110,103, a difference of 0.080%), Immigrants from Kazakhstan ($110,137, a difference of 0.11%), Immigrants from Lebanon ($110,159, a difference of 0.13%), and Jordanian ($109,865, a difference of 0.13%).
| Demographics | Rating | Rank | Median Family Income |
| Romanians | 98.8 /100 | #88 | Exceptional $111,243 |
| Immigrants | Argentina | 98.5 /100 | #89 | Exceptional $110,873 |
| Northern Europeans | 98.3 /100 | #90 | Exceptional $110,635 |
| Immigrants | Southern Europe | 98.3 /100 | #91 | Exceptional $110,614 |
| Immigrants | Lebanon | 97.9 /100 | #92 | Exceptional $110,159 |
| Immigrants | Kazakhstan | 97.8 /100 | #93 | Exceptional $110,137 |
| Koreans | 97.8 /100 | #94 | Exceptional $110,103 |
| Zimbabweans | 97.7 /100 | #95 | Exceptional $110,011 |
| Immigrants | Moldova | 97.7 /100 | #96 | Exceptional $109,975 |
| Jordanians | 97.5 /100 | #97 | Exceptional $109,865 |
| Immigrants | Kuwait | 97.4 /100 | #98 | Exceptional $109,731 |
| Armenians | 97.3 /100 | #99 | Exceptional $109,692 |
| Macedonians | 97.3 /100 | #100 | Exceptional $109,668 |
| Immigrants | Ukraine | 97.2 /100 | #101 | Exceptional $109,645 |
| Assyrians/Chaldeans/Syriacs | 97.2 /100 | #102 | Exceptional $109,622 |
Demographics Similar to Whites/Caucasians by Median Family Income
In terms of median family income, the demographic groups most similar to Whites/Caucasians are Immigrants from Thailand ($99,840, a difference of 0.040%), Spanish ($99,977, a difference of 0.18%), Scotch-Irish ($99,591, a difference of 0.21%), Yugoslavian ($100,119, a difference of 0.32%), and Immigrants from Africa ($100,256, a difference of 0.46%).
| Demographics | Rating | Rank | Median Family Income |
| Immigrants | South America | 23.9 /100 | #195 | Fair $100,414 |
| Samoans | 23.3 /100 | #196 | Fair $100,344 |
| Immigrants | Cameroon | 22.8 /100 | #197 | Fair $100,289 |
| Immigrants | Africa | 22.5 /100 | #198 | Fair $100,256 |
| Yugoslavians | 21.3 /100 | #199 | Fair $100,119 |
| Spanish | 20.1 /100 | #200 | Fair $99,977 |
| Immigrants | Thailand | 19.0 /100 | #201 | Poor $99,840 |
| Whites/Caucasians | 18.7 /100 | #202 | Poor $99,800 |
| Scotch-Irish | 17.1 /100 | #203 | Poor $99,591 |
| Ghanaians | 12.6 /100 | #204 | Poor $98,877 |
| Hawaiians | 12.5 /100 | #205 | Poor $98,869 |
| Immigrants | Iraq | 12.1 /100 | #206 | Poor $98,786 |
| Aleuts | 11.6 /100 | #207 | Poor $98,702 |
| Immigrants | Uruguay | 9.2 /100 | #208 | Tragic $98,205 |
| Immigrants | Colombia | 8.7 /100 | #209 | Tragic $98,067 |