Immigrants from Caribbean vs White/Caucasian Median Family Income
COMPARE
Immigrants from Caribbean
White/Caucasian
Median Family Income
Median Family Income Comparison
Immigrants from Caribbean
Whites/Caucasians
$83,319
MEDIAN FAMILY INCOME
0.0/ 100
METRIC RATING
321st/ 347
METRIC RANK
$99,800
MEDIAN FAMILY INCOME
18.7/ 100
METRIC RATING
202nd/ 347
METRIC RANK
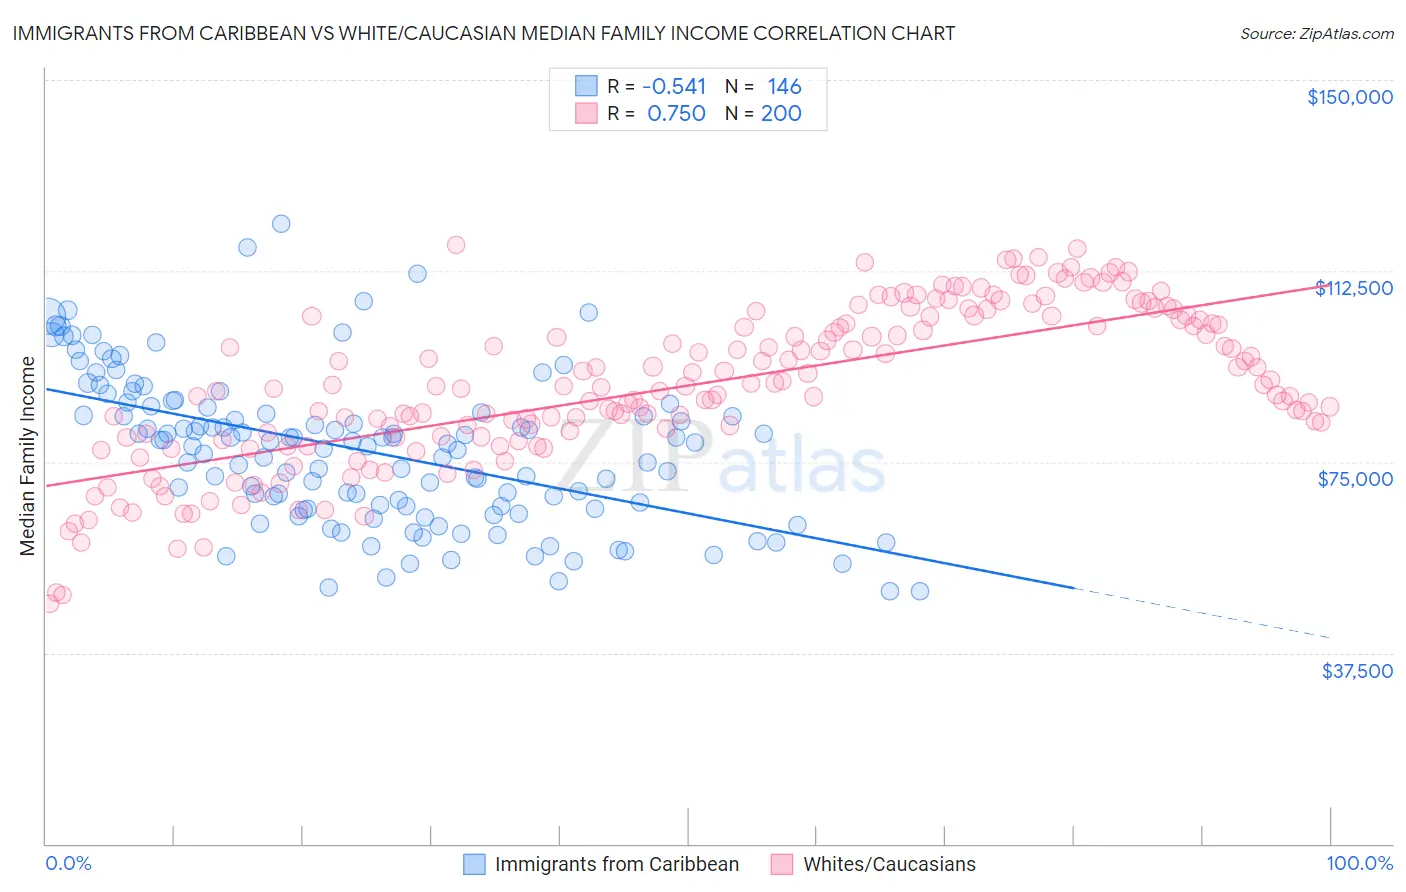
Immigrants from Caribbean vs White/Caucasian Median Family Income Correlation Chart
The statistical analysis conducted on geographies consisting of 449,450,188 people shows a substantial negative correlation between the proportion of Immigrants from Caribbean and median family income in the United States with a correlation coefficient (R) of -0.541 and weighted average of $83,319. Similarly, the statistical analysis conducted on geographies consisting of 582,814,142 people shows a strong positive correlation between the proportion of Whites/Caucasians and median family income in the United States with a correlation coefficient (R) of 0.750 and weighted average of $99,800, a difference of 19.8%.
Median Family Income Correlation Summary
| Measurement | Immigrants from Caribbean | White/Caucasian |
| Minimum | $49,547 | $47,087 |
| Maximum | $121,711 | $117,539 |
| Range | $72,164 | $70,452 |
| Mean | $77,294 | $89,997 |
| Median | $78,717 | $89,813 |
| Interquartile 25% (IQ1) | $66,192 | $80,036 |
| Interquartile 75% (IQ3) | $85,685 | $102,904 |
| Interquartile Range (IQR) | $19,492 | $22,868 |
| Standard Deviation (Sample) | $14,692 | $15,237 |
| Standard Deviation (Population) | $14,641 | $15,199 |
Similar Demographics by Median Family Income
Demographics Similar to Immigrants from Caribbean by Median Family Income
In terms of median family income, the demographic groups most similar to Immigrants from Caribbean are Seminole ($83,354, a difference of 0.040%), Immigrants from Honduras ($83,618, a difference of 0.36%), Immigrants from Mexico ($83,639, a difference of 0.38%), Dominican ($82,888, a difference of 0.52%), and Yakama ($83,932, a difference of 0.74%).
| Demographics | Rating | Rank | Median Family Income |
| Immigrants | Bahamas | 0.0 /100 | #314 | Tragic $84,732 |
| Apache | 0.0 /100 | #315 | Tragic $84,451 |
| Immigrants | Haiti | 0.0 /100 | #316 | Tragic $84,018 |
| Yakama | 0.0 /100 | #317 | Tragic $83,932 |
| Immigrants | Mexico | 0.0 /100 | #318 | Tragic $83,639 |
| Immigrants | Honduras | 0.0 /100 | #319 | Tragic $83,618 |
| Seminole | 0.0 /100 | #320 | Tragic $83,354 |
| Immigrants | Caribbean | 0.0 /100 | #321 | Tragic $83,319 |
| Dominicans | 0.0 /100 | #322 | Tragic $82,888 |
| Bahamians | 0.0 /100 | #323 | Tragic $82,631 |
| Creek | 0.0 /100 | #324 | Tragic $82,560 |
| Sioux | 0.0 /100 | #325 | Tragic $82,386 |
| Immigrants | Congo | 0.0 /100 | #326 | Tragic $82,216 |
| Arapaho | 0.0 /100 | #327 | Tragic $82,064 |
| Blacks/African Americans | 0.0 /100 | #328 | Tragic $81,912 |
Demographics Similar to Whites/Caucasians by Median Family Income
In terms of median family income, the demographic groups most similar to Whites/Caucasians are Immigrants from Thailand ($99,840, a difference of 0.040%), Spanish ($99,977, a difference of 0.18%), Scotch-Irish ($99,591, a difference of 0.21%), Yugoslavian ($100,119, a difference of 0.32%), and Immigrants from Africa ($100,256, a difference of 0.46%).
| Demographics | Rating | Rank | Median Family Income |
| Immigrants | South America | 23.9 /100 | #195 | Fair $100,414 |
| Samoans | 23.3 /100 | #196 | Fair $100,344 |
| Immigrants | Cameroon | 22.8 /100 | #197 | Fair $100,289 |
| Immigrants | Africa | 22.5 /100 | #198 | Fair $100,256 |
| Yugoslavians | 21.3 /100 | #199 | Fair $100,119 |
| Spanish | 20.1 /100 | #200 | Fair $99,977 |
| Immigrants | Thailand | 19.0 /100 | #201 | Poor $99,840 |
| Whites/Caucasians | 18.7 /100 | #202 | Poor $99,800 |
| Scotch-Irish | 17.1 /100 | #203 | Poor $99,591 |
| Ghanaians | 12.6 /100 | #204 | Poor $98,877 |
| Hawaiians | 12.5 /100 | #205 | Poor $98,869 |
| Immigrants | Iraq | 12.1 /100 | #206 | Poor $98,786 |
| Aleuts | 11.6 /100 | #207 | Poor $98,702 |
| Immigrants | Uruguay | 9.2 /100 | #208 | Tragic $98,205 |
| Immigrants | Colombia | 8.7 /100 | #209 | Tragic $98,067 |