Cajun vs White/Caucasian Median Family Income
COMPARE
Cajun
White/Caucasian
Median Family Income
Median Family Income Comparison
Cajuns
Whites/Caucasians
$87,157
MEDIAN FAMILY INCOME
0.0/ 100
METRIC RATING
297th/ 347
METRIC RANK
$99,800
MEDIAN FAMILY INCOME
18.7/ 100
METRIC RATING
202nd/ 347
METRIC RANK
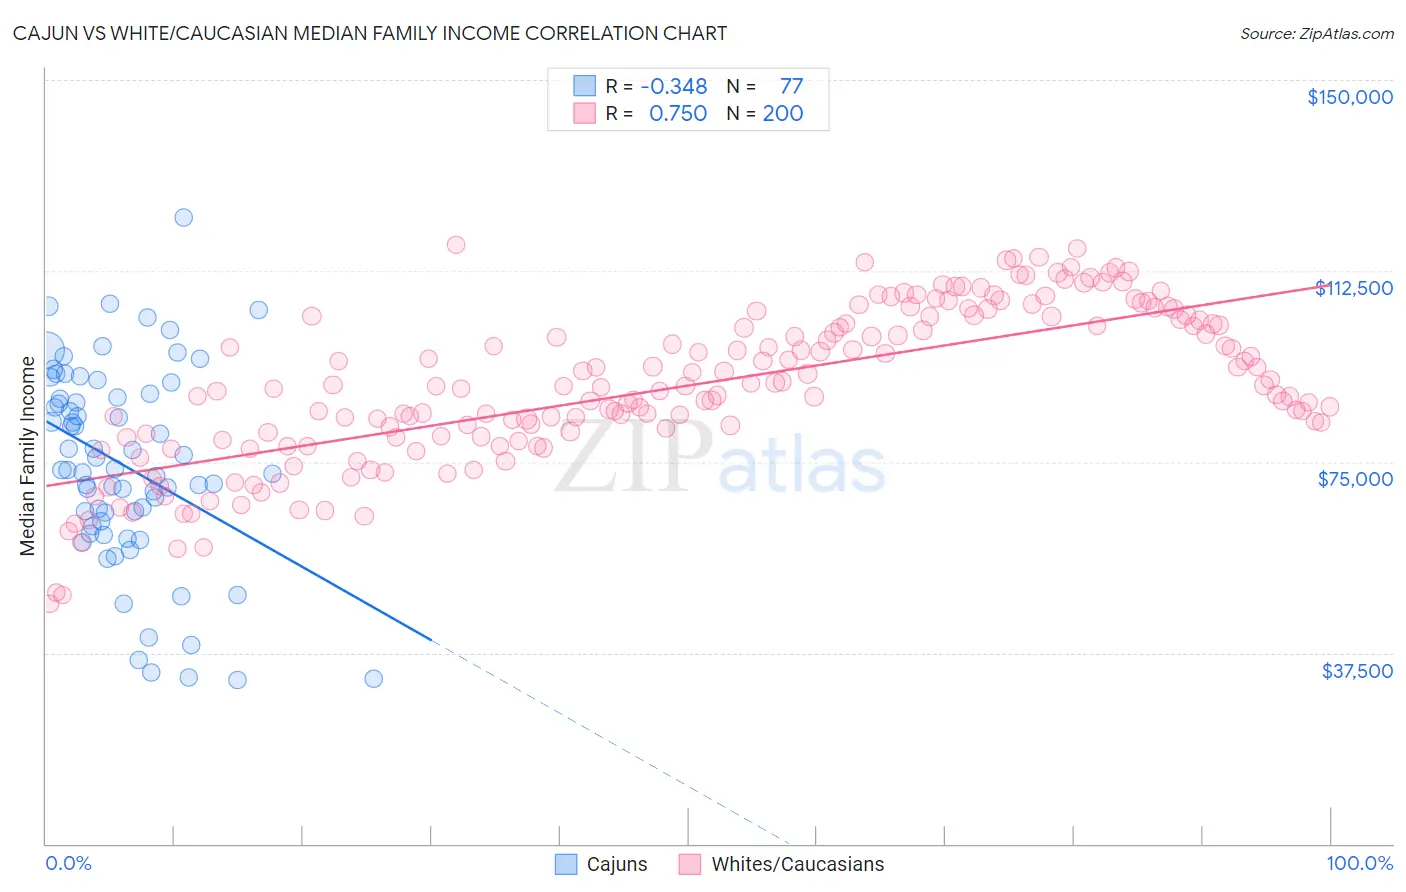
Cajun vs White/Caucasian Median Family Income Correlation Chart
The statistical analysis conducted on geographies consisting of 149,670,371 people shows a mild negative correlation between the proportion of Cajuns and median family income in the United States with a correlation coefficient (R) of -0.348 and weighted average of $87,157. Similarly, the statistical analysis conducted on geographies consisting of 582,814,142 people shows a strong positive correlation between the proportion of Whites/Caucasians and median family income in the United States with a correlation coefficient (R) of 0.750 and weighted average of $99,800, a difference of 14.5%.
Median Family Income Correlation Summary
| Measurement | Cajun | White/Caucasian |
| Minimum | $32,222 | $47,087 |
| Maximum | $122,896 | $117,539 |
| Range | $90,674 | $70,452 |
| Mean | $74,286 | $89,997 |
| Median | $73,392 | $89,813 |
| Interquartile 25% (IQ1) | $62,875 | $80,036 |
| Interquartile 75% (IQ3) | $88,056 | $102,904 |
| Interquartile Range (IQR) | $25,181 | $22,868 |
| Standard Deviation (Sample) | $19,414 | $15,237 |
| Standard Deviation (Population) | $19,288 | $15,199 |
Similar Demographics by Median Family Income
Demographics Similar to Cajuns by Median Family Income
In terms of median family income, the demographic groups most similar to Cajuns are Immigrants from Guatemala ($87,191, a difference of 0.040%), Yaqui ($87,289, a difference of 0.15%), Immigrants from Latin America ($86,989, a difference of 0.19%), Fijian ($87,387, a difference of 0.26%), and Chippewa ($86,852, a difference of 0.35%).
| Demographics | Rating | Rank | Median Family Income |
| Shoshone | 0.1 /100 | #290 | Tragic $87,872 |
| Immigrants | Cabo Verde | 0.1 /100 | #291 | Tragic $87,830 |
| Africans | 0.1 /100 | #292 | Tragic $87,820 |
| Ute | 0.0 /100 | #293 | Tragic $87,596 |
| Fijians | 0.0 /100 | #294 | Tragic $87,387 |
| Yaqui | 0.0 /100 | #295 | Tragic $87,289 |
| Immigrants | Guatemala | 0.0 /100 | #296 | Tragic $87,191 |
| Cajuns | 0.0 /100 | #297 | Tragic $87,157 |
| Immigrants | Latin America | 0.0 /100 | #298 | Tragic $86,989 |
| Chippewa | 0.0 /100 | #299 | Tragic $86,852 |
| Ottawa | 0.0 /100 | #300 | Tragic $86,380 |
| Colville | 0.0 /100 | #301 | Tragic $85,792 |
| Spanish American Indians | 0.0 /100 | #302 | Tragic $85,728 |
| Hispanics or Latinos | 0.0 /100 | #303 | Tragic $85,647 |
| Mexicans | 0.0 /100 | #304 | Tragic $85,618 |
Demographics Similar to Whites/Caucasians by Median Family Income
In terms of median family income, the demographic groups most similar to Whites/Caucasians are Immigrants from Thailand ($99,840, a difference of 0.040%), Spanish ($99,977, a difference of 0.18%), Scotch-Irish ($99,591, a difference of 0.21%), Yugoslavian ($100,119, a difference of 0.32%), and Immigrants from Africa ($100,256, a difference of 0.46%).
| Demographics | Rating | Rank | Median Family Income |
| Immigrants | South America | 23.9 /100 | #195 | Fair $100,414 |
| Samoans | 23.3 /100 | #196 | Fair $100,344 |
| Immigrants | Cameroon | 22.8 /100 | #197 | Fair $100,289 |
| Immigrants | Africa | 22.5 /100 | #198 | Fair $100,256 |
| Yugoslavians | 21.3 /100 | #199 | Fair $100,119 |
| Spanish | 20.1 /100 | #200 | Fair $99,977 |
| Immigrants | Thailand | 19.0 /100 | #201 | Poor $99,840 |
| Whites/Caucasians | 18.7 /100 | #202 | Poor $99,800 |
| Scotch-Irish | 17.1 /100 | #203 | Poor $99,591 |
| Ghanaians | 12.6 /100 | #204 | Poor $98,877 |
| Hawaiians | 12.5 /100 | #205 | Poor $98,869 |
| Immigrants | Iraq | 12.1 /100 | #206 | Poor $98,786 |
| Aleuts | 11.6 /100 | #207 | Poor $98,702 |
| Immigrants | Uruguay | 9.2 /100 | #208 | Tragic $98,205 |
| Immigrants | Colombia | 8.7 /100 | #209 | Tragic $98,067 |