Zimbabwean vs Crow Median Family Income
COMPARE
Zimbabwean
Crow
Median Family Income
Median Family Income Comparison
Zimbabweans
Crow
$110,011
MEDIAN FAMILY INCOME
97.7/ 100
METRIC RATING
95th/ 347
METRIC RANK
$76,605
MEDIAN FAMILY INCOME
0.0/ 100
METRIC RATING
342nd/ 347
METRIC RANK
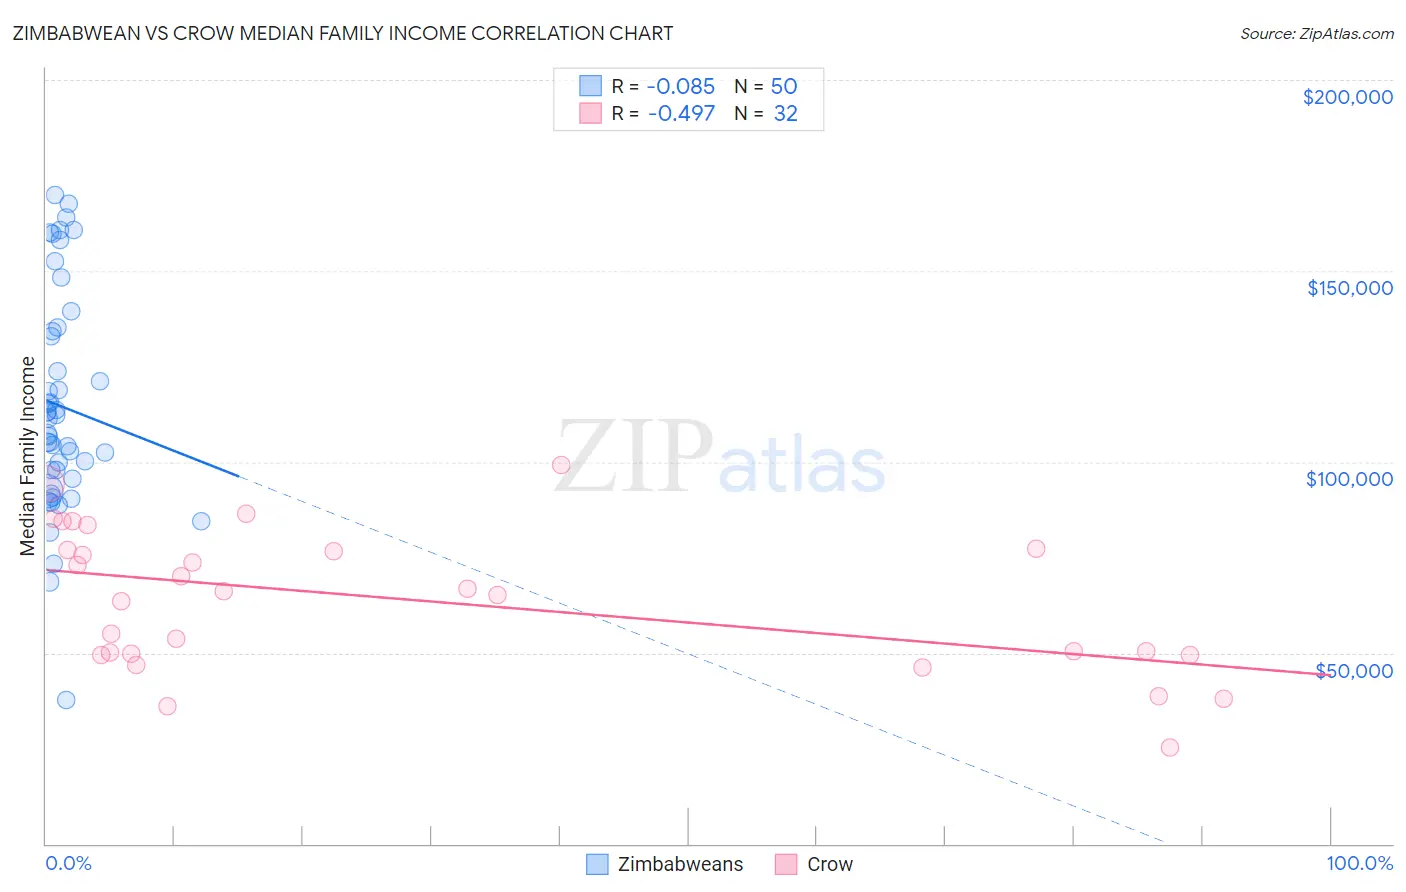
Zimbabwean vs Crow Median Family Income Correlation Chart
The statistical analysis conducted on geographies consisting of 69,185,684 people shows a slight negative correlation between the proportion of Zimbabweans and median family income in the United States with a correlation coefficient (R) of -0.085 and weighted average of $110,011. Similarly, the statistical analysis conducted on geographies consisting of 59,195,543 people shows a moderate negative correlation between the proportion of Crow and median family income in the United States with a correlation coefficient (R) of -0.497 and weighted average of $76,605, a difference of 43.6%.
Median Family Income Correlation Summary
| Measurement | Zimbabwean | Crow |
| Minimum | $37,500 | $25,179 |
| Maximum | $169,922 | $99,219 |
| Range | $132,422 | $74,040 |
| Mean | $114,541 | $63,807 |
| Median | $109,407 | $65,747 |
| Interquartile 25% (IQ1) | $95,466 | $49,683 |
| Interquartile 75% (IQ3) | $134,100 | $77,098 |
| Interquartile Range (IQR) | $38,634 | $27,414 |
| Standard Deviation (Sample) | $28,953 | $18,632 |
| Standard Deviation (Population) | $28,662 | $18,339 |
Similar Demographics by Median Family Income
Demographics Similar to Zimbabweans by Median Family Income
In terms of median family income, the demographic groups most similar to Zimbabweans are Immigrants from Moldova ($109,975, a difference of 0.030%), Korean ($110,103, a difference of 0.080%), Immigrants from Kazakhstan ($110,137, a difference of 0.11%), Immigrants from Lebanon ($110,159, a difference of 0.13%), and Jordanian ($109,865, a difference of 0.13%).
| Demographics | Rating | Rank | Median Family Income |
| Romanians | 98.8 /100 | #88 | Exceptional $111,243 |
| Immigrants | Argentina | 98.5 /100 | #89 | Exceptional $110,873 |
| Northern Europeans | 98.3 /100 | #90 | Exceptional $110,635 |
| Immigrants | Southern Europe | 98.3 /100 | #91 | Exceptional $110,614 |
| Immigrants | Lebanon | 97.9 /100 | #92 | Exceptional $110,159 |
| Immigrants | Kazakhstan | 97.8 /100 | #93 | Exceptional $110,137 |
| Koreans | 97.8 /100 | #94 | Exceptional $110,103 |
| Zimbabweans | 97.7 /100 | #95 | Exceptional $110,011 |
| Immigrants | Moldova | 97.7 /100 | #96 | Exceptional $109,975 |
| Jordanians | 97.5 /100 | #97 | Exceptional $109,865 |
| Immigrants | Kuwait | 97.4 /100 | #98 | Exceptional $109,731 |
| Armenians | 97.3 /100 | #99 | Exceptional $109,692 |
| Macedonians | 97.3 /100 | #100 | Exceptional $109,668 |
| Immigrants | Ukraine | 97.2 /100 | #101 | Exceptional $109,645 |
| Assyrians/Chaldeans/Syriacs | 97.2 /100 | #102 | Exceptional $109,622 |
Demographics Similar to Crow by Median Family Income
In terms of median family income, the demographic groups most similar to Crow are Pueblo ($76,880, a difference of 0.36%), Houma ($76,188, a difference of 0.55%), Hopi ($77,188, a difference of 0.76%), Pima ($77,431, a difference of 1.1%), and Immigrants from Yemen ($77,457, a difference of 1.1%).
| Demographics | Rating | Rank | Median Family Income |
| Kiowa | 0.0 /100 | #333 | Tragic $80,885 |
| Menominee | 0.0 /100 | #334 | Tragic $79,563 |
| Yup'ik | 0.0 /100 | #335 | Tragic $79,290 |
| Immigrants | Cuba | 0.0 /100 | #336 | Tragic $78,249 |
| Yuman | 0.0 /100 | #337 | Tragic $78,055 |
| Immigrants | Yemen | 0.0 /100 | #338 | Tragic $77,457 |
| Pima | 0.0 /100 | #339 | Tragic $77,431 |
| Hopi | 0.0 /100 | #340 | Tragic $77,188 |
| Pueblo | 0.0 /100 | #341 | Tragic $76,880 |
| Crow | 0.0 /100 | #342 | Tragic $76,605 |
| Houma | 0.0 /100 | #343 | Tragic $76,188 |
| Tohono O'odham | 0.0 /100 | #344 | Tragic $72,193 |
| Navajo | 0.0 /100 | #345 | Tragic $70,989 |
| Puerto Ricans | 0.0 /100 | #346 | Tragic $70,423 |
| Lumbee | 0.0 /100 | #347 | Tragic $68,679 |