Zimbabwean vs White/Caucasian 1 or more Vehicles in Household
COMPARE
Zimbabwean
White/Caucasian
1 or more Vehicles in Household
1 or more Vehicles in Household Comparison
Zimbabweans
Whites/Caucasians
91.0%
1 OR MORE VEHICLES IN HOUSEHOLD
97.7/ 100
METRIC RATING
106th/ 347
METRIC RANK
93.1%
1 OR MORE VEHICLES IN HOUSEHOLD
100.0/ 100
METRIC RATING
13th/ 347
METRIC RANK
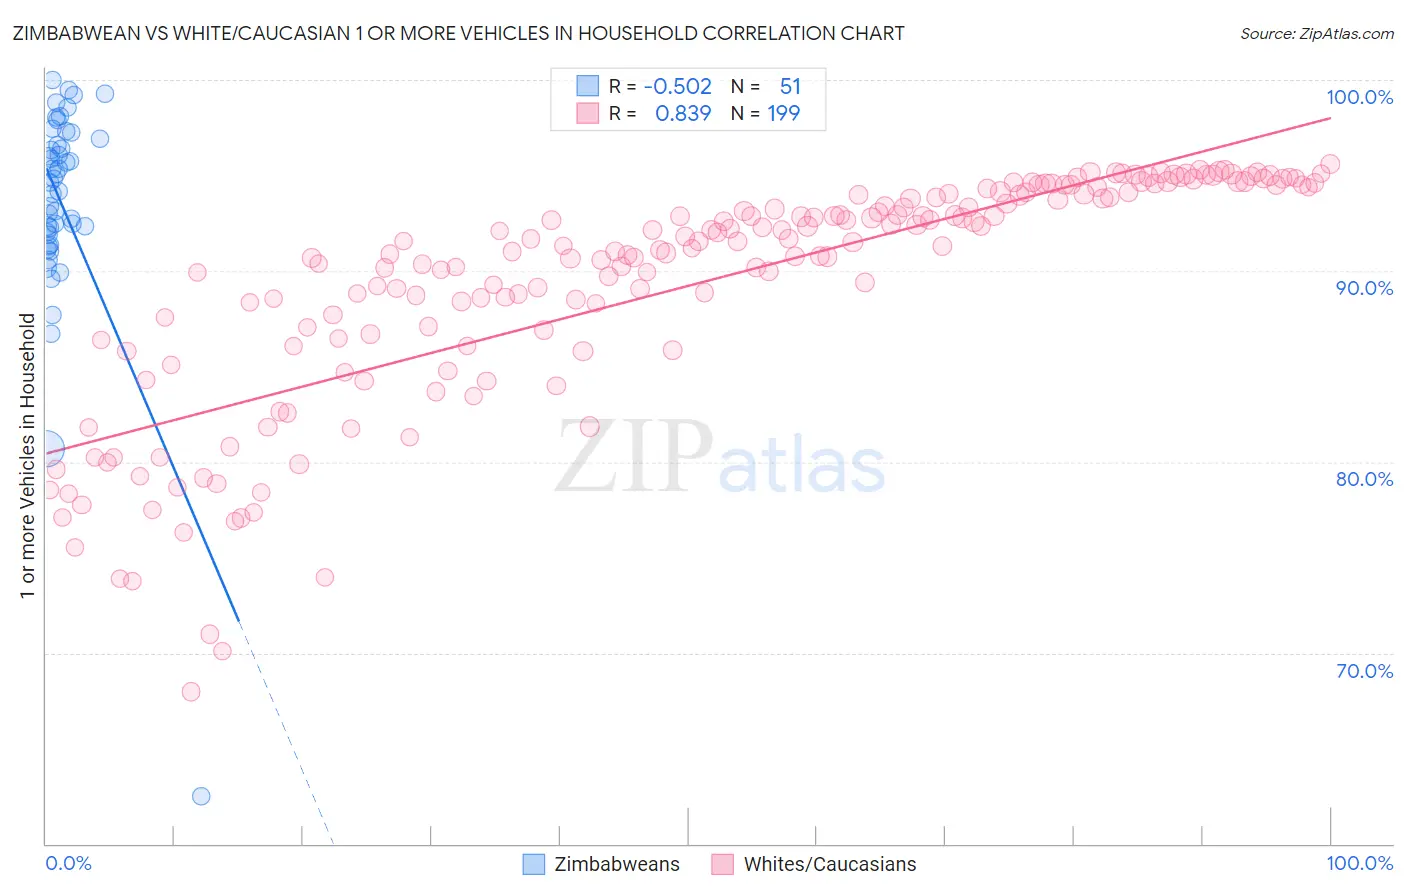
Zimbabwean vs White/Caucasian 1 or more Vehicles in Household Correlation Chart
The statistical analysis conducted on geographies consisting of 69,192,017 people shows a substantial negative correlation between the proportion of Zimbabweans and percentage of households with 1 or more vehicles available in the United States with a correlation coefficient (R) of -0.502 and weighted average of 91.0%. Similarly, the statistical analysis conducted on geographies consisting of 571,958,607 people shows a very strong positive correlation between the proportion of Whites/Caucasians and percentage of households with 1 or more vehicles available in the United States with a correlation coefficient (R) of 0.839 and weighted average of 93.1%, a difference of 2.3%.
1 or more Vehicles in Household Correlation Summary
| Measurement | Zimbabwean | White/Caucasian |
| Minimum | 62.5% | 68.0% |
| Maximum | 100.0% | 95.6% |
| Range | 37.5% | 27.6% |
| Mean | 93.6% | 89.2% |
| Median | 94.6% | 91.3% |
| Interquartile 25% (IQ1) | 91.9% | 86.4% |
| Interquartile 75% (IQ3) | 96.9% | 94.0% |
| Interquartile Range (IQR) | 5.0% | 7.6% |
| Standard Deviation (Sample) | 5.8% | 6.1% |
| Standard Deviation (Population) | 5.7% | 6.1% |
Similar Demographics by 1 or more Vehicles in Household
Demographics Similar to Zimbabweans by 1 or more Vehicles in Household
In terms of 1 or more vehicles in household, the demographic groups most similar to Zimbabweans are Maltese (91.0%, a difference of 0.020%), Hispanic or Latino (91.0%, a difference of 0.020%), Delaware (91.0%, a difference of 0.020%), Laotian (91.0%, a difference of 0.040%), and Mexican American Indian (91.0%, a difference of 0.050%).
| Demographics | Rating | Rank | 1 or more Vehicles in Household |
| Immigrants | Bolivia | 98.6 /100 | #99 | Exceptional 91.2% |
| Immigrants | Central America | 98.4 /100 | #100 | Exceptional 91.1% |
| Bulgarians | 98.4 /100 | #101 | Exceptional 91.1% |
| Seminole | 98.3 /100 | #102 | Exceptional 91.1% |
| Yugoslavians | 98.3 /100 | #103 | Exceptional 91.1% |
| Asians | 98.2 /100 | #104 | Exceptional 91.1% |
| Laotians | 98.0 /100 | #105 | Exceptional 91.0% |
| Zimbabweans | 97.7 /100 | #106 | Exceptional 91.0% |
| Maltese | 97.7 /100 | #107 | Exceptional 91.0% |
| Hispanics or Latinos | 97.6 /100 | #108 | Exceptional 91.0% |
| Delaware | 97.6 /100 | #109 | Exceptional 91.0% |
| Mexican American Indians | 97.4 /100 | #110 | Exceptional 91.0% |
| Navajo | 95.8 /100 | #111 | Exceptional 90.8% |
| Immigrants | Netherlands | 95.7 /100 | #112 | Exceptional 90.8% |
| Immigrants | Kuwait | 94.7 /100 | #113 | Exceptional 90.7% |
Demographics Similar to Whites/Caucasians by 1 or more Vehicles in Household
In terms of 1 or more vehicles in household, the demographic groups most similar to Whites/Caucasians are Scandinavian (93.1%, a difference of 0.020%), Irish (93.1%, a difference of 0.040%), Mexican (93.0%, a difference of 0.060%), Assyrian/Chaldean/Syriac (93.0%, a difference of 0.060%), and European (93.0%, a difference of 0.090%).
| Demographics | Rating | Rank | 1 or more Vehicles in Household |
| Danes | 100.0 /100 | #6 | Exceptional 93.5% |
| Scottish | 100.0 /100 | #7 | Exceptional 93.4% |
| Swedes | 100.0 /100 | #8 | Exceptional 93.3% |
| Scotch-Irish | 100.0 /100 | #9 | Exceptional 93.3% |
| Dutch | 100.0 /100 | #10 | Exceptional 93.3% |
| Czechs | 100.0 /100 | #11 | Exceptional 93.3% |
| Scandinavians | 100.0 /100 | #12 | Exceptional 93.1% |
| Whites/Caucasians | 100.0 /100 | #13 | Exceptional 93.1% |
| Irish | 100.0 /100 | #14 | Exceptional 93.1% |
| Mexicans | 100.0 /100 | #15 | Exceptional 93.0% |
| Assyrians/Chaldeans/Syriacs | 100.0 /100 | #16 | Exceptional 93.0% |
| Europeans | 100.0 /100 | #17 | Exceptional 93.0% |
| Welsh | 100.0 /100 | #18 | Exceptional 93.0% |
| Tongans | 100.0 /100 | #19 | Exceptional 92.9% |
| Arapaho | 100.0 /100 | #20 | Exceptional 92.7% |