Zimbabwean vs Swedish Median Family Income
COMPARE
Zimbabwean
Swedish
Median Family Income
Median Family Income Comparison
Zimbabweans
Swedes
$110,011
MEDIAN FAMILY INCOME
97.7/ 100
METRIC RATING
95th/ 347
METRIC RANK
$108,499
MEDIAN FAMILY INCOME
95.1/ 100
METRIC RATING
115th/ 347
METRIC RANK
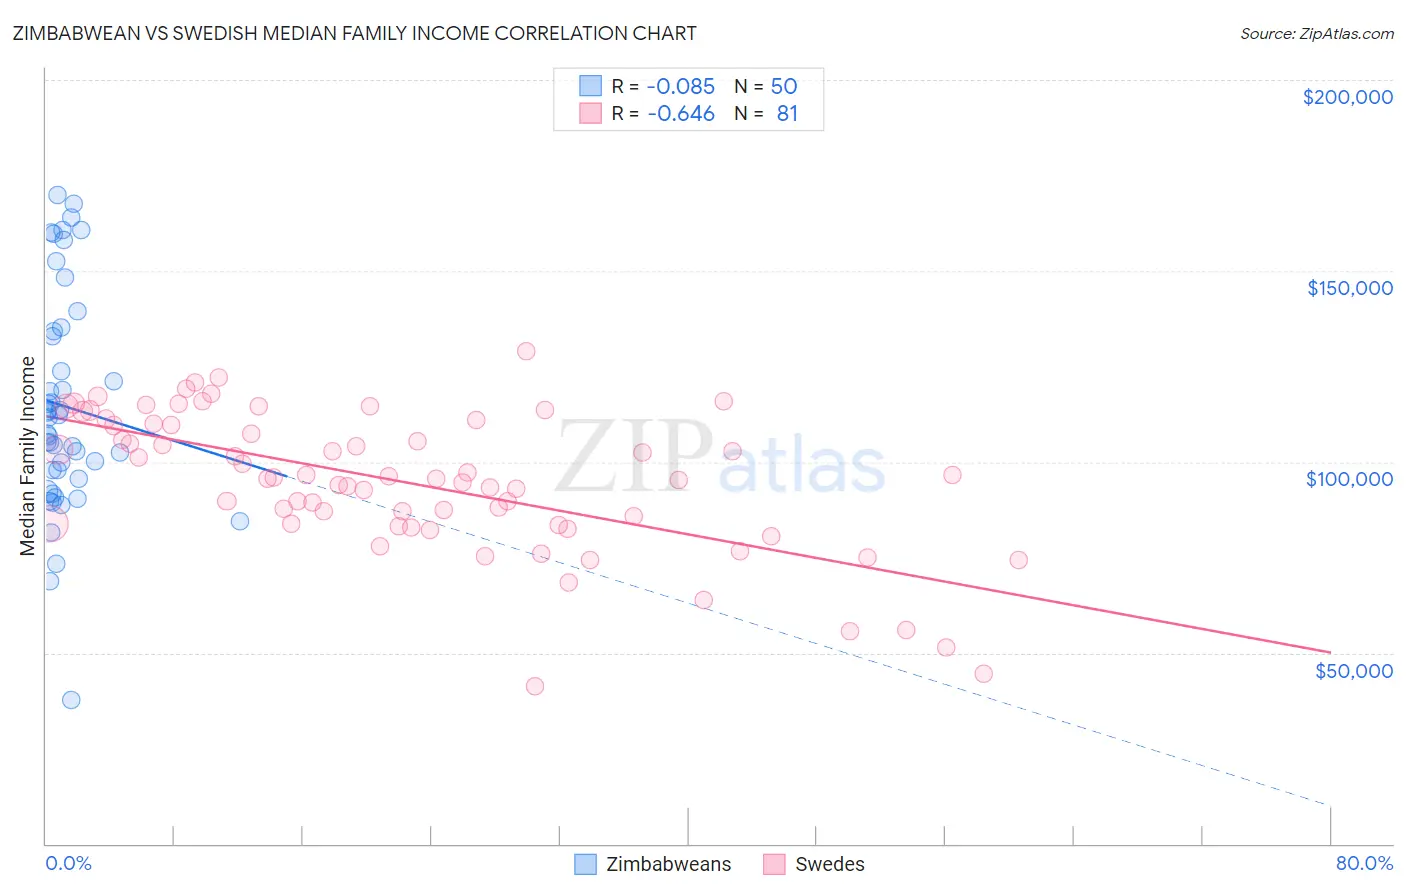
Zimbabwean vs Swedish Median Family Income Correlation Chart
The statistical analysis conducted on geographies consisting of 69,185,684 people shows a slight negative correlation between the proportion of Zimbabweans and median family income in the United States with a correlation coefficient (R) of -0.085 and weighted average of $110,011. Similarly, the statistical analysis conducted on geographies consisting of 538,326,829 people shows a significant negative correlation between the proportion of Swedes and median family income in the United States with a correlation coefficient (R) of -0.646 and weighted average of $108,499, a difference of 1.4%.
Median Family Income Correlation Summary
| Measurement | Zimbabwean | Swedish |
| Minimum | $37,500 | $41,250 |
| Maximum | $169,922 | $128,899 |
| Range | $132,422 | $87,649 |
| Mean | $114,541 | $94,659 |
| Median | $109,407 | $95,565 |
| Interquartile 25% (IQ1) | $95,466 | $83,510 |
| Interquartile 75% (IQ3) | $134,100 | $109,800 |
| Interquartile Range (IQR) | $38,634 | $26,290 |
| Standard Deviation (Sample) | $28,953 | $18,382 |
| Standard Deviation (Population) | $28,662 | $18,268 |
Demographics Similar to Zimbabweans and Swedes by Median Family Income
In terms of median family income, the demographic groups most similar to Zimbabweans are Immigrants from Moldova ($109,975, a difference of 0.030%), Jordanian ($109,865, a difference of 0.13%), Immigrants from Kuwait ($109,731, a difference of 0.25%), Armenian ($109,692, a difference of 0.29%), and Macedonian ($109,668, a difference of 0.31%). Similarly, the demographic groups most similar to Swedes are Polish ($108,507, a difference of 0.010%), Immigrants from Saudi Arabia ($108,544, a difference of 0.040%), Immigrants from Poland ($108,570, a difference of 0.070%), Immigrants from Western Asia ($108,691, a difference of 0.18%), and Immigrants from Afghanistan ($108,709, a difference of 0.19%).
| Demographics | Rating | Rank | Median Family Income |
| Zimbabweans | 97.7 /100 | #95 | Exceptional $110,011 |
| Immigrants | Moldova | 97.7 /100 | #96 | Exceptional $109,975 |
| Jordanians | 97.5 /100 | #97 | Exceptional $109,865 |
| Immigrants | Kuwait | 97.4 /100 | #98 | Exceptional $109,731 |
| Armenians | 97.3 /100 | #99 | Exceptional $109,692 |
| Macedonians | 97.3 /100 | #100 | Exceptional $109,668 |
| Immigrants | Ukraine | 97.2 /100 | #101 | Exceptional $109,645 |
| Assyrians/Chaldeans/Syriacs | 97.2 /100 | #102 | Exceptional $109,622 |
| Immigrants | Brazil | 96.9 /100 | #103 | Exceptional $109,418 |
| Palestinians | 96.9 /100 | #104 | Exceptional $109,413 |
| Syrians | 96.7 /100 | #105 | Exceptional $109,299 |
| Albanians | 96.4 /100 | #106 | Exceptional $109,136 |
| Immigrants | North Macedonia | 96.4 /100 | #107 | Exceptional $109,136 |
| Immigrants | Zimbabwe | 95.9 /100 | #108 | Exceptional $108,830 |
| Immigrants | Afghanistan | 95.6 /100 | #109 | Exceptional $108,709 |
| British | 95.6 /100 | #110 | Exceptional $108,705 |
| Immigrants | Western Asia | 95.6 /100 | #111 | Exceptional $108,691 |
| Immigrants | Poland | 95.3 /100 | #112 | Exceptional $108,570 |
| Immigrants | Saudi Arabia | 95.2 /100 | #113 | Exceptional $108,544 |
| Poles | 95.2 /100 | #114 | Exceptional $108,507 |
| Swedes | 95.1 /100 | #115 | Exceptional $108,499 |