Immigrants from Turkey vs White/Caucasian Median Family Income
COMPARE
Immigrants from Turkey
White/Caucasian
Median Family Income
Median Family Income Comparison
Immigrants from Turkey
Whites/Caucasians
$118,325
MEDIAN FAMILY INCOME
100.0/ 100
METRIC RATING
38th/ 347
METRIC RANK
$99,800
MEDIAN FAMILY INCOME
18.7/ 100
METRIC RATING
202nd/ 347
METRIC RANK
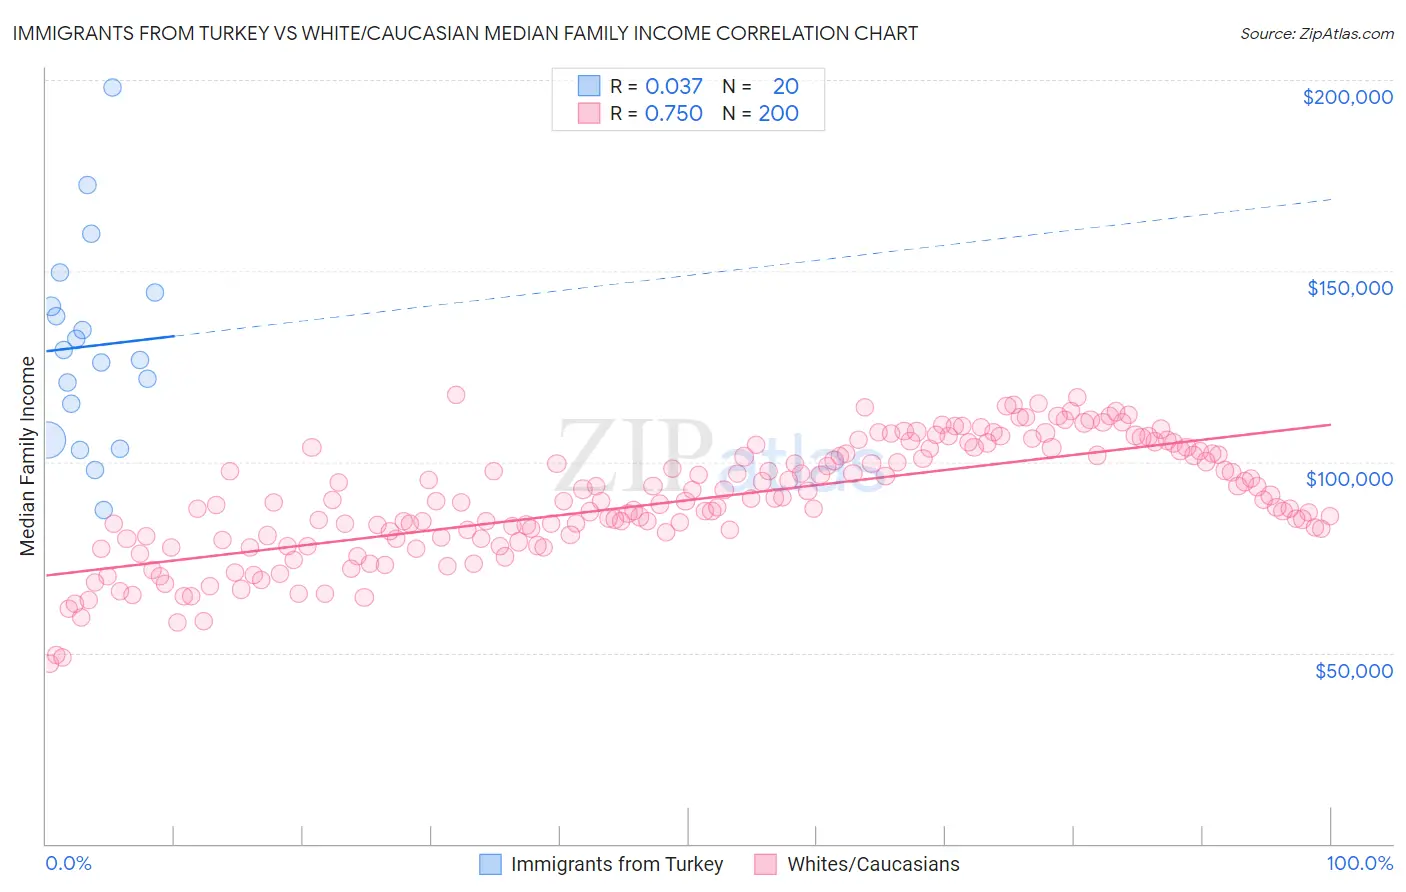
Immigrants from Turkey vs White/Caucasian Median Family Income Correlation Chart
The statistical analysis conducted on geographies consisting of 222,914,261 people shows no correlation between the proportion of Immigrants from Turkey and median family income in the United States with a correlation coefficient (R) of 0.037 and weighted average of $118,325. Similarly, the statistical analysis conducted on geographies consisting of 582,814,142 people shows a strong positive correlation between the proportion of Whites/Caucasians and median family income in the United States with a correlation coefficient (R) of 0.750 and weighted average of $99,800, a difference of 18.6%.
Median Family Income Correlation Summary
| Measurement | Immigrants from Turkey | White/Caucasian |
| Minimum | $87,281 | $47,087 |
| Maximum | $197,922 | $117,539 |
| Range | $110,641 | $70,452 |
| Mean | $130,330 | $89,997 |
| Median | $128,029 | $89,813 |
| Interquartile 25% (IQ1) | $110,406 | $80,036 |
| Interquartile 75% (IQ3) | $142,421 | $102,904 |
| Interquartile Range (IQR) | $32,015 | $22,868 |
| Standard Deviation (Sample) | $26,517 | $15,237 |
| Standard Deviation (Population) | $25,846 | $15,199 |
Similar Demographics by Median Family Income
Demographics Similar to Immigrants from Turkey by Median Family Income
In terms of median family income, the demographic groups most similar to Immigrants from Turkey are Immigrants from Asia ($118,291, a difference of 0.030%), Australian ($118,440, a difference of 0.10%), Israeli ($118,577, a difference of 0.21%), Immigrants from Lithuania ($118,053, a difference of 0.23%), and Estonian ($118,013, a difference of 0.26%).
| Demographics | Rating | Rank | Median Family Income |
| Immigrants | France | 100.0 /100 | #31 | Exceptional $120,076 |
| Asians | 100.0 /100 | #32 | Exceptional $119,955 |
| Bhutanese | 100.0 /100 | #33 | Exceptional $119,800 |
| Bolivians | 100.0 /100 | #34 | Exceptional $119,479 |
| Soviet Union | 100.0 /100 | #35 | Exceptional $119,262 |
| Israelis | 100.0 /100 | #36 | Exceptional $118,577 |
| Australians | 100.0 /100 | #37 | Exceptional $118,440 |
| Immigrants | Turkey | 100.0 /100 | #38 | Exceptional $118,325 |
| Immigrants | Asia | 100.0 /100 | #39 | Exceptional $118,291 |
| Immigrants | Lithuania | 100.0 /100 | #40 | Exceptional $118,053 |
| Estonians | 100.0 /100 | #41 | Exceptional $118,013 |
| Immigrants | Bolivia | 100.0 /100 | #42 | Exceptional $117,912 |
| Bulgarians | 100.0 /100 | #43 | Exceptional $117,818 |
| Cambodians | 100.0 /100 | #44 | Exceptional $117,780 |
| Immigrants | Greece | 99.9 /100 | #45 | Exceptional $117,344 |
Demographics Similar to Whites/Caucasians by Median Family Income
In terms of median family income, the demographic groups most similar to Whites/Caucasians are Immigrants from Thailand ($99,840, a difference of 0.040%), Spanish ($99,977, a difference of 0.18%), Scotch-Irish ($99,591, a difference of 0.21%), Yugoslavian ($100,119, a difference of 0.32%), and Immigrants from Africa ($100,256, a difference of 0.46%).
| Demographics | Rating | Rank | Median Family Income |
| Immigrants | South America | 23.9 /100 | #195 | Fair $100,414 |
| Samoans | 23.3 /100 | #196 | Fair $100,344 |
| Immigrants | Cameroon | 22.8 /100 | #197 | Fair $100,289 |
| Immigrants | Africa | 22.5 /100 | #198 | Fair $100,256 |
| Yugoslavians | 21.3 /100 | #199 | Fair $100,119 |
| Spanish | 20.1 /100 | #200 | Fair $99,977 |
| Immigrants | Thailand | 19.0 /100 | #201 | Poor $99,840 |
| Whites/Caucasians | 18.7 /100 | #202 | Poor $99,800 |
| Scotch-Irish | 17.1 /100 | #203 | Poor $99,591 |
| Ghanaians | 12.6 /100 | #204 | Poor $98,877 |
| Hawaiians | 12.5 /100 | #205 | Poor $98,869 |
| Immigrants | Iraq | 12.1 /100 | #206 | Poor $98,786 |
| Aleuts | 11.6 /100 | #207 | Poor $98,702 |
| Immigrants | Uruguay | 9.2 /100 | #208 | Tragic $98,205 |
| Immigrants | Colombia | 8.7 /100 | #209 | Tragic $98,067 |