Yugoslavian vs Immigrants from Micronesia 1st Grade
COMPARE
Yugoslavian
Immigrants from Micronesia
1st Grade
1st Grade Comparison
Yugoslavians
Immigrants from Micronesia
98.2%
1ST GRADE
95.5/ 100
METRIC RATING
117th/ 347
METRIC RANK
97.9%
1ST GRADE
55.3/ 100
METRIC RATING
169th/ 347
METRIC RANK
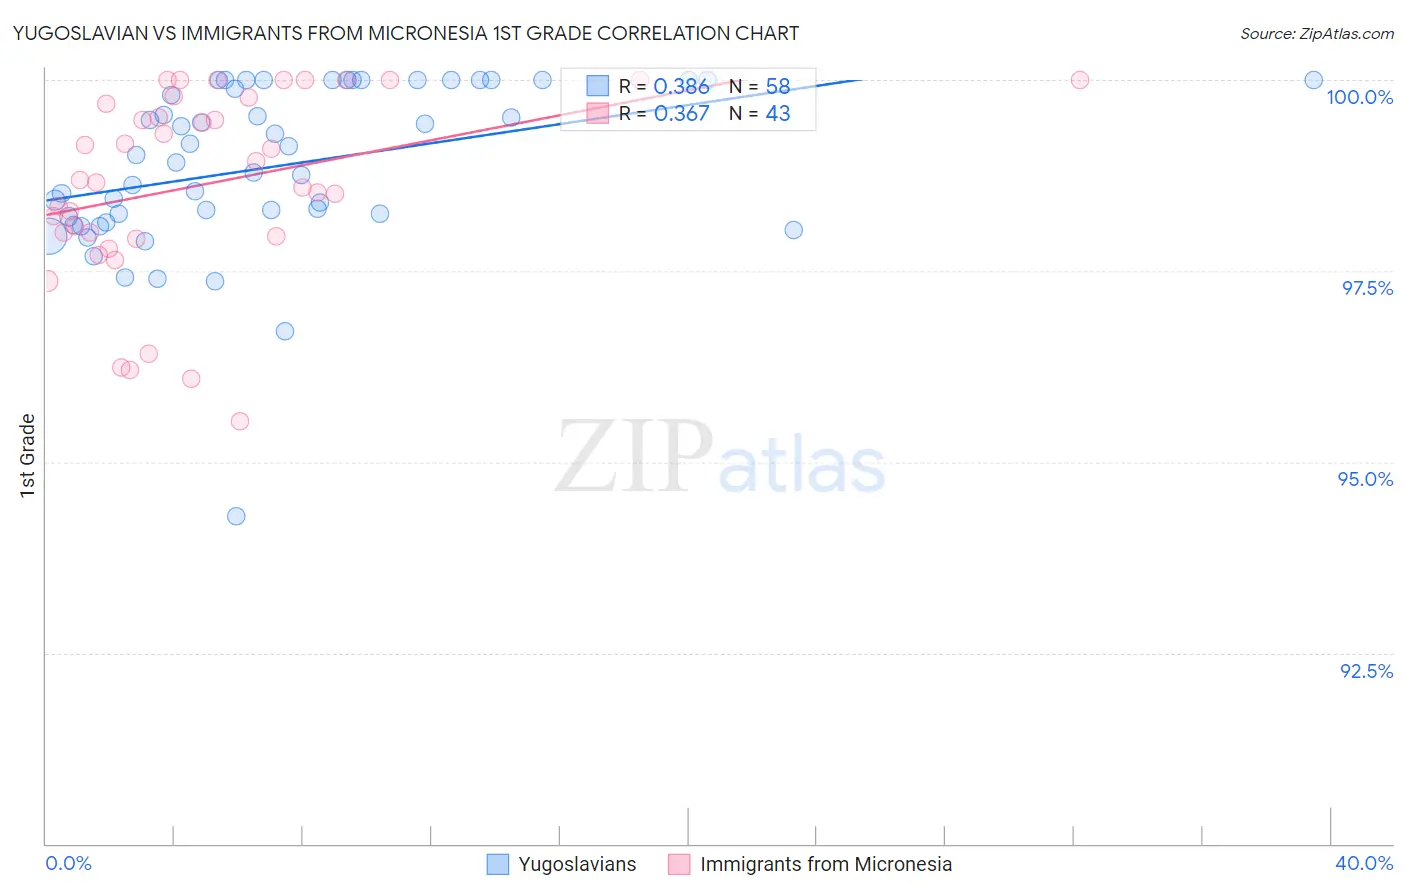
Yugoslavian vs Immigrants from Micronesia 1st Grade Correlation Chart
The statistical analysis conducted on geographies consisting of 285,681,276 people shows a mild positive correlation between the proportion of Yugoslavians and percentage of population with at least 1st grade education in the United States with a correlation coefficient (R) of 0.386 and weighted average of 98.2%. Similarly, the statistical analysis conducted on geographies consisting of 61,604,657 people shows a mild positive correlation between the proportion of Immigrants from Micronesia and percentage of population with at least 1st grade education in the United States with a correlation coefficient (R) of 0.367 and weighted average of 97.9%, a difference of 0.22%.
1st Grade Correlation Summary
| Measurement | Yugoslavian | Immigrants from Micronesia |
| Minimum | 94.3% | 95.5% |
| Maximum | 100.0% | 100.0% |
| Range | 5.7% | 4.5% |
| Mean | 98.9% | 98.6% |
| Median | 99.0% | 98.7% |
| Interquartile 25% (IQ1) | 98.2% | 98.0% |
| Interquartile 75% (IQ3) | 100.0% | 99.8% |
| Interquartile Range (IQR) | 1.8% | 1.8% |
| Standard Deviation (Sample) | 1.1% | 1.2% |
| Standard Deviation (Population) | 1.1% | 1.2% |
Similar Demographics by 1st Grade
Demographics Similar to Yugoslavians by 1st Grade
In terms of 1st grade, the demographic groups most similar to Yugoslavians are Immigrants from France (98.2%, a difference of 0.0%), Ute (98.2%, a difference of 0.010%), Iranian (98.2%, a difference of 0.010%), Spanish (98.2%, a difference of 0.010%), and Thai (98.1%, a difference of 0.010%).
| Demographics | Rating | Rank | 1st Grade |
| Immigrants | Singapore | 96.7 /100 | #110 | Exceptional 98.2% |
| Immigrants | Czechoslovakia | 96.6 /100 | #111 | Exceptional 98.2% |
| Immigrants | Norway | 96.6 /100 | #112 | Exceptional 98.2% |
| Immigrants | Latvia | 96.4 /100 | #113 | Exceptional 98.2% |
| Ute | 96.2 /100 | #114 | Exceptional 98.2% |
| Iranians | 96.0 /100 | #115 | Exceptional 98.2% |
| Spanish | 95.9 /100 | #116 | Exceptional 98.2% |
| Yugoslavians | 95.5 /100 | #117 | Exceptional 98.2% |
| Immigrants | France | 95.5 /100 | #118 | Exceptional 98.2% |
| Thais | 94.7 /100 | #119 | Exceptional 98.1% |
| Okinawans | 94.5 /100 | #120 | Exceptional 98.1% |
| Immigrants | Zimbabwe | 94.0 /100 | #121 | Exceptional 98.1% |
| Menominee | 93.9 /100 | #122 | Exceptional 98.1% |
| Iroquois | 93.8 /100 | #123 | Exceptional 98.1% |
| Syrians | 93.7 /100 | #124 | Exceptional 98.1% |
Demographics Similar to Immigrants from Micronesia by 1st Grade
In terms of 1st grade, the demographic groups most similar to Immigrants from Micronesia are Ugandan (97.9%, a difference of 0.0%), Navajo (97.9%, a difference of 0.0%), Bermudan (97.9%, a difference of 0.0%), Chilean (97.9%, a difference of 0.0%), and Immigrants from Spain (97.9%, a difference of 0.0%).
| Demographics | Rating | Rank | 1st Grade |
| Immigrants | Eastern Europe | 58.9 /100 | #162 | Average 97.9% |
| Spanish Americans | 57.7 /100 | #163 | Average 97.9% |
| Brazilians | 57.6 /100 | #164 | Average 97.9% |
| Ugandans | 56.9 /100 | #165 | Average 97.9% |
| Navajo | 56.6 /100 | #166 | Average 97.9% |
| Bermudans | 56.3 /100 | #167 | Average 97.9% |
| Chileans | 55.6 /100 | #168 | Average 97.9% |
| Immigrants | Micronesia | 55.3 /100 | #169 | Average 97.9% |
| Immigrants | Spain | 54.9 /100 | #170 | Average 97.9% |
| Immigrants | Jordan | 53.9 /100 | #171 | Average 97.9% |
| Immigrants | Korea | 53.0 /100 | #172 | Average 97.9% |
| Kenyans | 51.2 /100 | #173 | Average 97.9% |
| Natives/Alaskans | 50.0 /100 | #174 | Average 97.9% |
| Immigrants | Sri Lanka | 49.7 /100 | #175 | Average 97.9% |
| Albanians | 49.6 /100 | #176 | Average 97.9% |