Yaqui vs Tlingit-Haida Per Capita Income
COMPARE
Yaqui
Tlingit-Haida
Per Capita Income
Per Capita Income Comparison
Yaqui
Tlingit-Haida
$36,112
PER CAPITA INCOME
0.0/ 100
METRIC RATING
315th/ 347
METRIC RANK
$43,516
PER CAPITA INCOME
45.9/ 100
METRIC RATING
177th/ 347
METRIC RANK
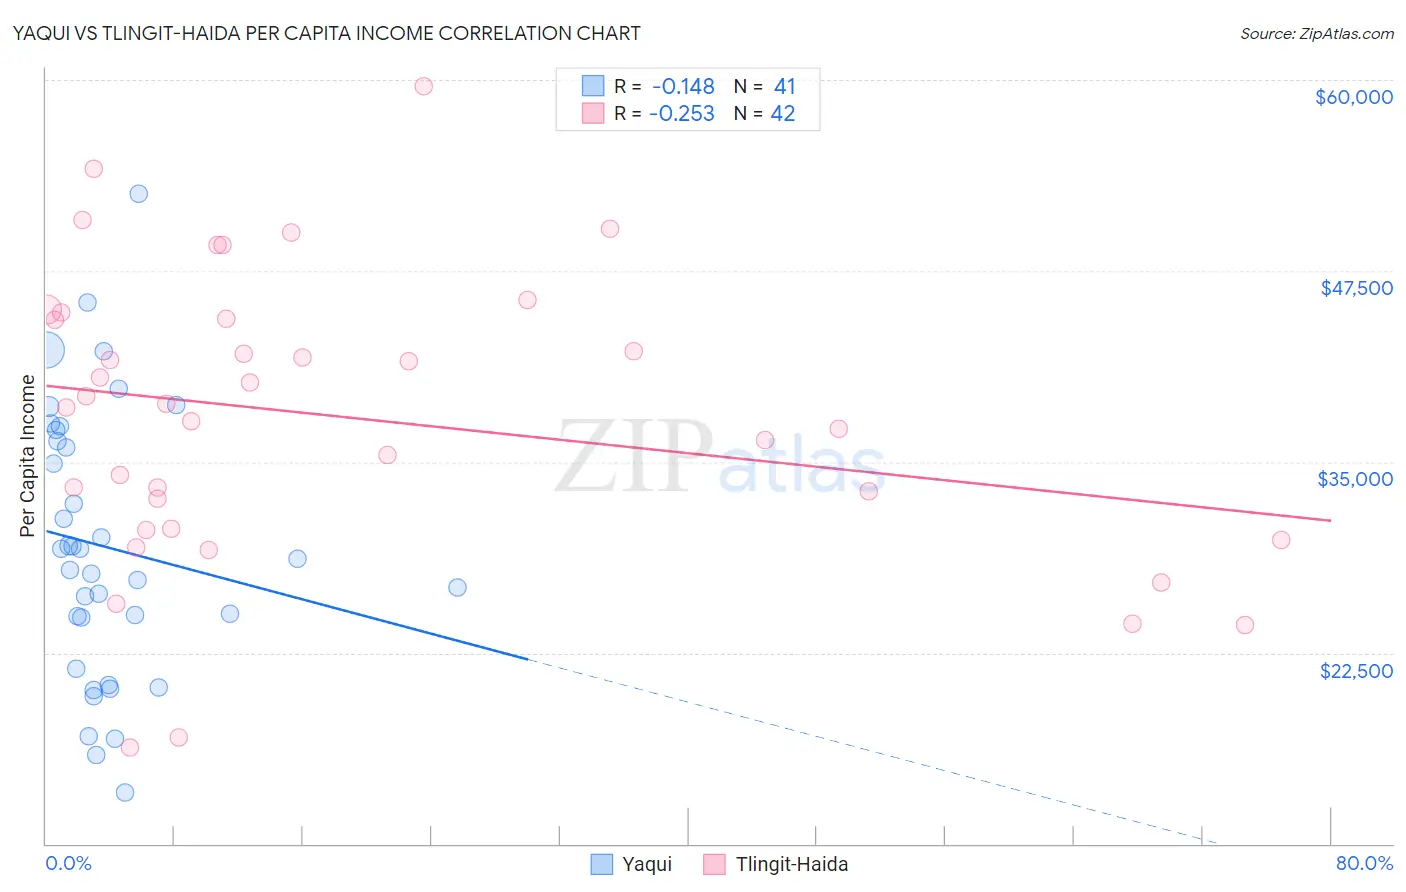
Yaqui vs Tlingit-Haida Per Capita Income Correlation Chart
The statistical analysis conducted on geographies consisting of 107,738,640 people shows a poor negative correlation between the proportion of Yaqui and per capita income in the United States with a correlation coefficient (R) of -0.148 and weighted average of $36,112. Similarly, the statistical analysis conducted on geographies consisting of 60,872,339 people shows a weak negative correlation between the proportion of Tlingit-Haida and per capita income in the United States with a correlation coefficient (R) of -0.253 and weighted average of $43,516, a difference of 20.5%.
Per Capita Income Correlation Summary
| Measurement | Yaqui | Tlingit-Haida |
| Minimum | $13,349 | $16,326 |
| Maximum | $52,546 | $59,619 |
| Range | $39,197 | $43,293 |
| Mean | $29,404 | $37,894 |
| Median | $28,671 | $38,682 |
| Interquartile 25% (IQ1) | $23,138 | $30,599 |
| Interquartile 75% (IQ3) | $36,720 | $44,372 |
| Interquartile Range (IQR) | $13,582 | $13,773 |
| Standard Deviation (Sample) | $8,788 | $9,586 |
| Standard Deviation (Population) | $8,680 | $9,471 |
Similar Demographics by Per Capita Income
Demographics Similar to Yaqui by Per Capita Income
In terms of per capita income, the demographic groups most similar to Yaqui are Seminole ($36,180, a difference of 0.19%), Choctaw ($35,999, a difference of 0.31%), Dutch West Indian ($35,922, a difference of 0.53%), Bangladeshi ($35,897, a difference of 0.60%), and Bahamian ($36,427, a difference of 0.87%).
| Demographics | Rating | Rank | Per Capita Income |
| Fijians | 0.0 /100 | #308 | Tragic $36,690 |
| Immigrants | Honduras | 0.0 /100 | #309 | Tragic $36,665 |
| Ute | 0.0 /100 | #310 | Tragic $36,651 |
| Chippewa | 0.0 /100 | #311 | Tragic $36,631 |
| Chickasaw | 0.0 /100 | #312 | Tragic $36,475 |
| Bahamians | 0.0 /100 | #313 | Tragic $36,427 |
| Seminole | 0.0 /100 | #314 | Tragic $36,180 |
| Yaqui | 0.0 /100 | #315 | Tragic $36,112 |
| Choctaw | 0.0 /100 | #316 | Tragic $35,999 |
| Dutch West Indians | 0.0 /100 | #317 | Tragic $35,922 |
| Bangladeshis | 0.0 /100 | #318 | Tragic $35,897 |
| Immigrants | Congo | 0.0 /100 | #319 | Tragic $35,720 |
| Hispanics or Latinos | 0.0 /100 | #320 | Tragic $35,688 |
| Blacks/African Americans | 0.0 /100 | #321 | Tragic $35,564 |
| Creek | 0.0 /100 | #322 | Tragic $35,546 |
Demographics Similar to Tlingit-Haida by Per Capita Income
In terms of per capita income, the demographic groups most similar to Tlingit-Haida are Immigrants from South Eastern Asia ($43,539, a difference of 0.050%), Immigrants from Costa Rica ($43,464, a difference of 0.12%), Finnish ($43,461, a difference of 0.13%), Celtic ($43,621, a difference of 0.24%), and Sierra Leonean ($43,405, a difference of 0.25%).
| Demographics | Rating | Rank | Per Capita Income |
| Scandinavians | 55.2 /100 | #170 | Average $43,848 |
| Immigrants | Eastern Africa | 54.9 /100 | #171 | Average $43,838 |
| Czechoslovakians | 54.1 /100 | #172 | Average $43,806 |
| French | 50.7 /100 | #173 | Average $43,685 |
| Colombians | 50.0 /100 | #174 | Average $43,661 |
| Celtics | 48.9 /100 | #175 | Average $43,621 |
| Immigrants | South Eastern Asia | 46.6 /100 | #176 | Average $43,539 |
| Tlingit-Haida | 45.9 /100 | #177 | Average $43,516 |
| Immigrants | Costa Rica | 44.5 /100 | #178 | Average $43,464 |
| Finns | 44.4 /100 | #179 | Average $43,461 |
| Sierra Leoneans | 42.9 /100 | #180 | Average $43,405 |
| Welsh | 38.2 /100 | #181 | Fair $43,233 |
| Immigrants | Vietnam | 38.1 /100 | #182 | Fair $43,229 |
| Germans | 33.9 /100 | #183 | Fair $43,067 |
| Spaniards | 32.9 /100 | #184 | Fair $43,028 |