Yaqui vs Iroquois Median Male Earnings
COMPARE
Yaqui
Iroquois
Median Male Earnings
Median Male Earnings Comparison
Yaqui
Iroquois
$46,777
MEDIAN MALE EARNINGS
0.1/ 100
METRIC RATING
303rd/ 347
METRIC RANK
$49,374
MEDIAN MALE EARNINGS
0.7/ 100
METRIC RATING
260th/ 347
METRIC RANK
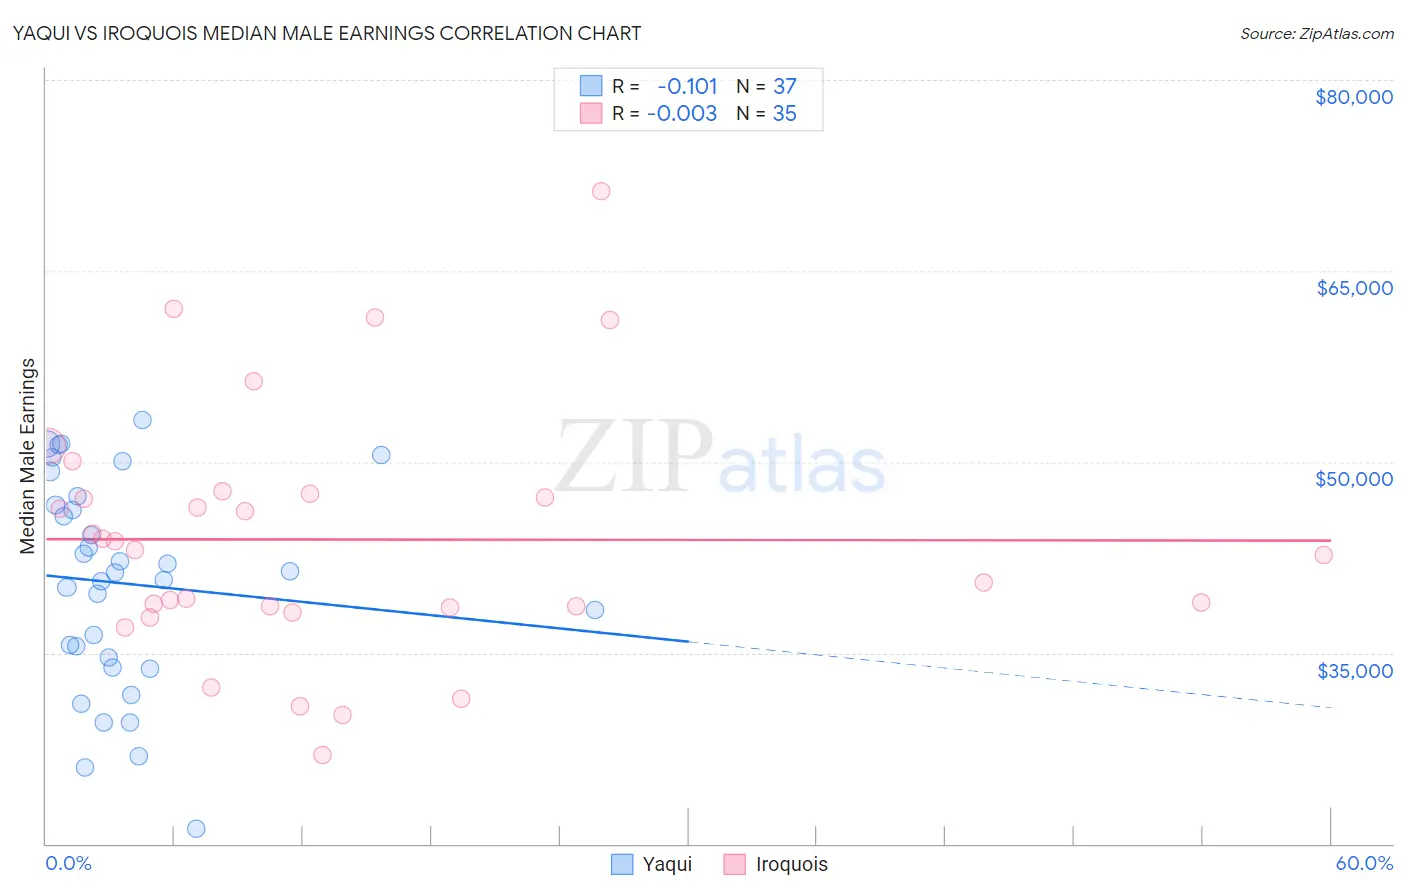
Yaqui vs Iroquois Median Male Earnings Correlation Chart
The statistical analysis conducted on geographies consisting of 107,723,867 people shows a poor negative correlation between the proportion of Yaqui and median male earnings in the United States with a correlation coefficient (R) of -0.101 and weighted average of $46,777. Similarly, the statistical analysis conducted on geographies consisting of 207,261,653 people shows no correlation between the proportion of Iroquois and median male earnings in the United States with a correlation coefficient (R) of -0.003 and weighted average of $49,374, a difference of 5.6%.
Median Male Earnings Correlation Summary
| Measurement | Yaqui | Iroquois |
| Minimum | $21,192 | $26,985 |
| Maximum | $53,274 | $71,281 |
| Range | $32,082 | $44,296 |
| Mean | $40,430 | $43,903 |
| Median | $41,328 | $43,033 |
| Interquartile 25% (IQ1) | $34,244 | $38,514 |
| Interquartile 75% (IQ3) | $46,983 | $47,481 |
| Interquartile Range (IQR) | $12,738 | $8,967 |
| Standard Deviation (Sample) | $8,232 | $9,773 |
| Standard Deviation (Population) | $8,120 | $9,632 |
Similar Demographics by Median Male Earnings
Demographics Similar to Yaqui by Median Male Earnings
In terms of median male earnings, the demographic groups most similar to Yaqui are Seminole ($46,783, a difference of 0.010%), Bangladeshi ($46,744, a difference of 0.070%), Guatemalan ($46,736, a difference of 0.090%), Dutch West Indian ($46,656, a difference of 0.26%), and Immigrants from Dominican Republic ($46,655, a difference of 0.26%).
| Demographics | Rating | Rank | Median Male Earnings |
| Inupiat | 0.1 /100 | #296 | Tragic $47,281 |
| Dominicans | 0.1 /100 | #297 | Tragic $47,204 |
| Immigrants | Micronesia | 0.1 /100 | #298 | Tragic $47,177 |
| Immigrants | Zaire | 0.1 /100 | #299 | Tragic $47,070 |
| U.S. Virgin Islanders | 0.1 /100 | #300 | Tragic $47,066 |
| Immigrants | Latin America | 0.1 /100 | #301 | Tragic $46,941 |
| Seminole | 0.1 /100 | #302 | Tragic $46,783 |
| Yaqui | 0.1 /100 | #303 | Tragic $46,777 |
| Bangladeshis | 0.1 /100 | #304 | Tragic $46,744 |
| Guatemalans | 0.0 /100 | #305 | Tragic $46,736 |
| Dutch West Indians | 0.0 /100 | #306 | Tragic $46,656 |
| Immigrants | Dominican Republic | 0.0 /100 | #307 | Tragic $46,655 |
| Ottawa | 0.0 /100 | #308 | Tragic $46,611 |
| Creek | 0.0 /100 | #309 | Tragic $46,594 |
| Cubans | 0.0 /100 | #310 | Tragic $46,580 |
Demographics Similar to Iroquois by Median Male Earnings
In terms of median male earnings, the demographic groups most similar to Iroquois are Liberian ($49,318, a difference of 0.11%), Nepalese ($49,458, a difference of 0.17%), Immigrants from West Indies ($49,271, a difference of 0.21%), Cree ($49,497, a difference of 0.25%), and Nicaraguan ($49,215, a difference of 0.32%).
| Demographics | Rating | Rank | Median Male Earnings |
| German Russians | 1.1 /100 | #253 | Tragic $49,924 |
| Senegalese | 1.0 /100 | #254 | Tragic $49,774 |
| Alaskan Athabascans | 0.9 /100 | #255 | Tragic $49,748 |
| Alaska Natives | 0.9 /100 | #256 | Tragic $49,711 |
| British West Indians | 0.8 /100 | #257 | Tragic $49,636 |
| Cree | 0.7 /100 | #258 | Tragic $49,497 |
| Nepalese | 0.7 /100 | #259 | Tragic $49,458 |
| Iroquois | 0.7 /100 | #260 | Tragic $49,374 |
| Liberians | 0.6 /100 | #261 | Tragic $49,318 |
| Immigrants | West Indies | 0.6 /100 | #262 | Tragic $49,271 |
| Nicaraguans | 0.6 /100 | #263 | Tragic $49,215 |
| Immigrants | Middle Africa | 0.6 /100 | #264 | Tragic $49,201 |
| Immigrants | Laos | 0.6 /100 | #265 | Tragic $49,190 |
| Somalis | 0.5 /100 | #266 | Tragic $49,025 |
| Spanish Americans | 0.5 /100 | #267 | Tragic $49,008 |