Yaqui vs Immigrants from Latvia Median Male Earnings
COMPARE
Yaqui
Immigrants from Latvia
Median Male Earnings
Median Male Earnings Comparison
Yaqui
Immigrants from Latvia
$46,777
MEDIAN MALE EARNINGS
0.1/ 100
METRIC RATING
303rd/ 347
METRIC RANK
$61,422
MEDIAN MALE EARNINGS
99.9/ 100
METRIC RATING
54th/ 347
METRIC RANK
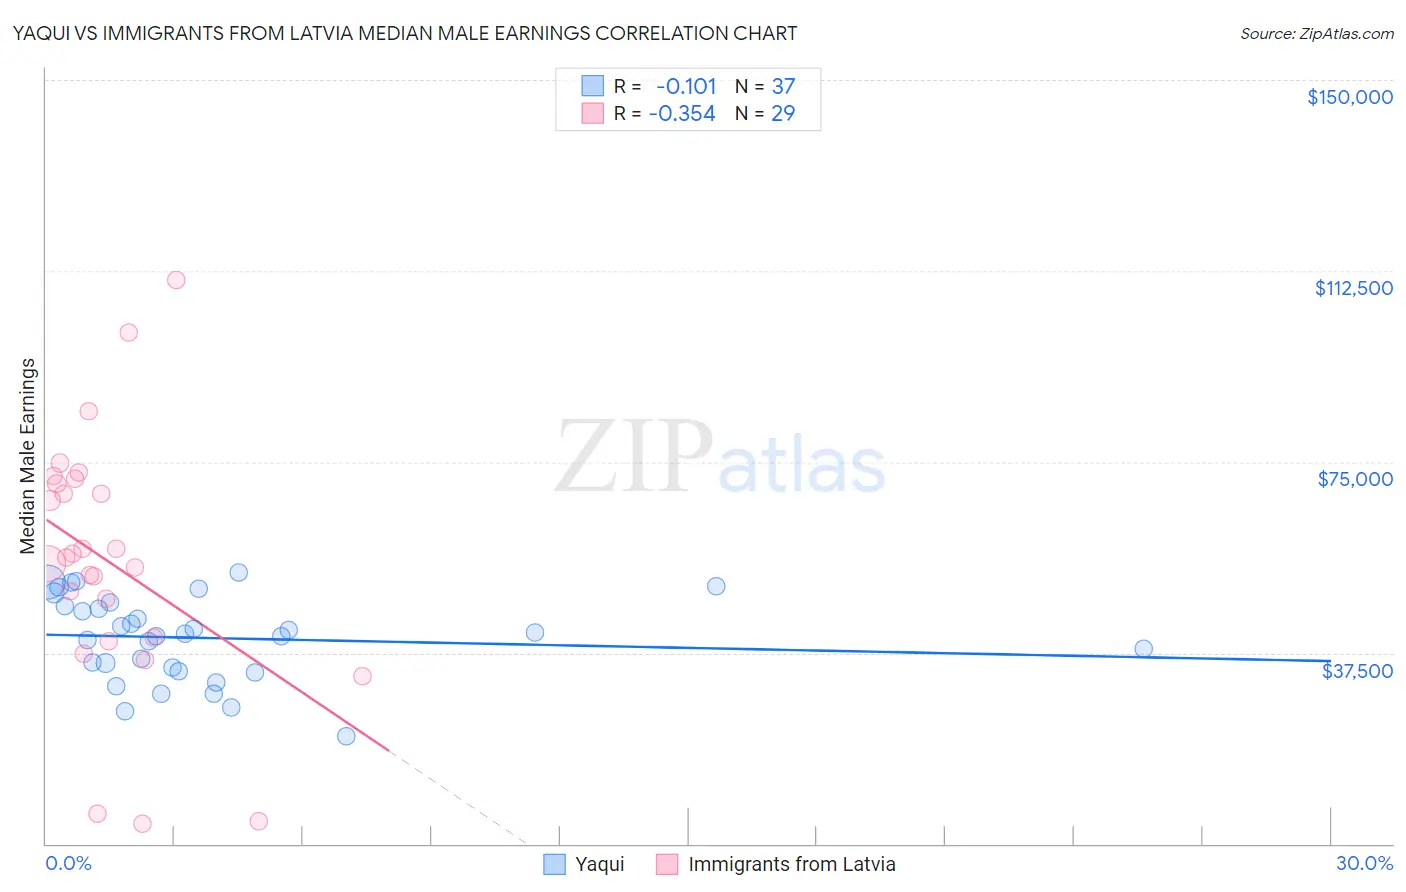
Yaqui vs Immigrants from Latvia Median Male Earnings Correlation Chart
The statistical analysis conducted on geographies consisting of 107,723,867 people shows a poor negative correlation between the proportion of Yaqui and median male earnings in the United States with a correlation coefficient (R) of -0.101 and weighted average of $46,777. Similarly, the statistical analysis conducted on geographies consisting of 113,724,849 people shows a mild negative correlation between the proportion of Immigrants from Latvia and median male earnings in the United States with a correlation coefficient (R) of -0.354 and weighted average of $61,422, a difference of 31.3%.
Median Male Earnings Correlation Summary
| Measurement | Yaqui | Immigrants from Latvia |
| Minimum | $21,192 | $3,900 |
| Maximum | $53,274 | $110,833 |
| Range | $32,082 | $106,933 |
| Mean | $40,430 | $55,354 |
| Median | $41,328 | $56,127 |
| Interquartile 25% (IQ1) | $34,244 | $40,143 |
| Interquartile 75% (IQ3) | $46,983 | $71,183 |
| Interquartile Range (IQR) | $12,738 | $31,039 |
| Standard Deviation (Sample) | $8,232 | $24,947 |
| Standard Deviation (Population) | $8,120 | $24,513 |
Similar Demographics by Median Male Earnings
Demographics Similar to Yaqui by Median Male Earnings
In terms of median male earnings, the demographic groups most similar to Yaqui are Seminole ($46,783, a difference of 0.010%), Bangladeshi ($46,744, a difference of 0.070%), Guatemalan ($46,736, a difference of 0.090%), Dutch West Indian ($46,656, a difference of 0.26%), and Immigrants from Dominican Republic ($46,655, a difference of 0.26%).
| Demographics | Rating | Rank | Median Male Earnings |
| Inupiat | 0.1 /100 | #296 | Tragic $47,281 |
| Dominicans | 0.1 /100 | #297 | Tragic $47,204 |
| Immigrants | Micronesia | 0.1 /100 | #298 | Tragic $47,177 |
| Immigrants | Zaire | 0.1 /100 | #299 | Tragic $47,070 |
| U.S. Virgin Islanders | 0.1 /100 | #300 | Tragic $47,066 |
| Immigrants | Latin America | 0.1 /100 | #301 | Tragic $46,941 |
| Seminole | 0.1 /100 | #302 | Tragic $46,783 |
| Yaqui | 0.1 /100 | #303 | Tragic $46,777 |
| Bangladeshis | 0.1 /100 | #304 | Tragic $46,744 |
| Guatemalans | 0.0 /100 | #305 | Tragic $46,736 |
| Dutch West Indians | 0.0 /100 | #306 | Tragic $46,656 |
| Immigrants | Dominican Republic | 0.0 /100 | #307 | Tragic $46,655 |
| Ottawa | 0.0 /100 | #308 | Tragic $46,611 |
| Creek | 0.0 /100 | #309 | Tragic $46,594 |
| Cubans | 0.0 /100 | #310 | Tragic $46,580 |
Demographics Similar to Immigrants from Latvia by Median Male Earnings
In terms of median male earnings, the demographic groups most similar to Immigrants from Latvia are South African ($61,460, a difference of 0.060%), Greek ($61,242, a difference of 0.29%), Lithuanian ($61,228, a difference of 0.32%), Immigrants from Scotland ($61,220, a difference of 0.33%), and Immigrants from Norway ($61,628, a difference of 0.34%).
| Demographics | Rating | Rank | Median Male Earnings |
| Immigrants | Austria | 99.9 /100 | #47 | Exceptional $62,164 |
| Immigrants | Malaysia | 99.9 /100 | #48 | Exceptional $62,121 |
| Immigrants | Europe | 99.9 /100 | #49 | Exceptional $62,057 |
| Bhutanese | 99.9 /100 | #50 | Exceptional $61,759 |
| Estonians | 99.9 /100 | #51 | Exceptional $61,710 |
| Immigrants | Norway | 99.9 /100 | #52 | Exceptional $61,628 |
| South Africans | 99.9 /100 | #53 | Exceptional $61,460 |
| Immigrants | Latvia | 99.9 /100 | #54 | Exceptional $61,422 |
| Greeks | 99.9 /100 | #55 | Exceptional $61,242 |
| Lithuanians | 99.9 /100 | #56 | Exceptional $61,228 |
| Immigrants | Scotland | 99.9 /100 | #57 | Exceptional $61,220 |
| New Zealanders | 99.9 /100 | #58 | Exceptional $61,199 |
| Immigrants | Netherlands | 99.8 /100 | #59 | Exceptional $61,096 |
| Egyptians | 99.8 /100 | #60 | Exceptional $61,095 |
| Bolivians | 99.8 /100 | #61 | Exceptional $61,066 |