Yaqui vs Sudanese Median Family Income
COMPARE
Yaqui
Sudanese
Median Family Income
Median Family Income Comparison
Yaqui
Sudanese
$87,289
MEDIAN FAMILY INCOME
0.0/ 100
METRIC RATING
295th/ 347
METRIC RANK
$96,783
MEDIAN FAMILY INCOME
4.7/ 100
METRIC RATING
220th/ 347
METRIC RANK
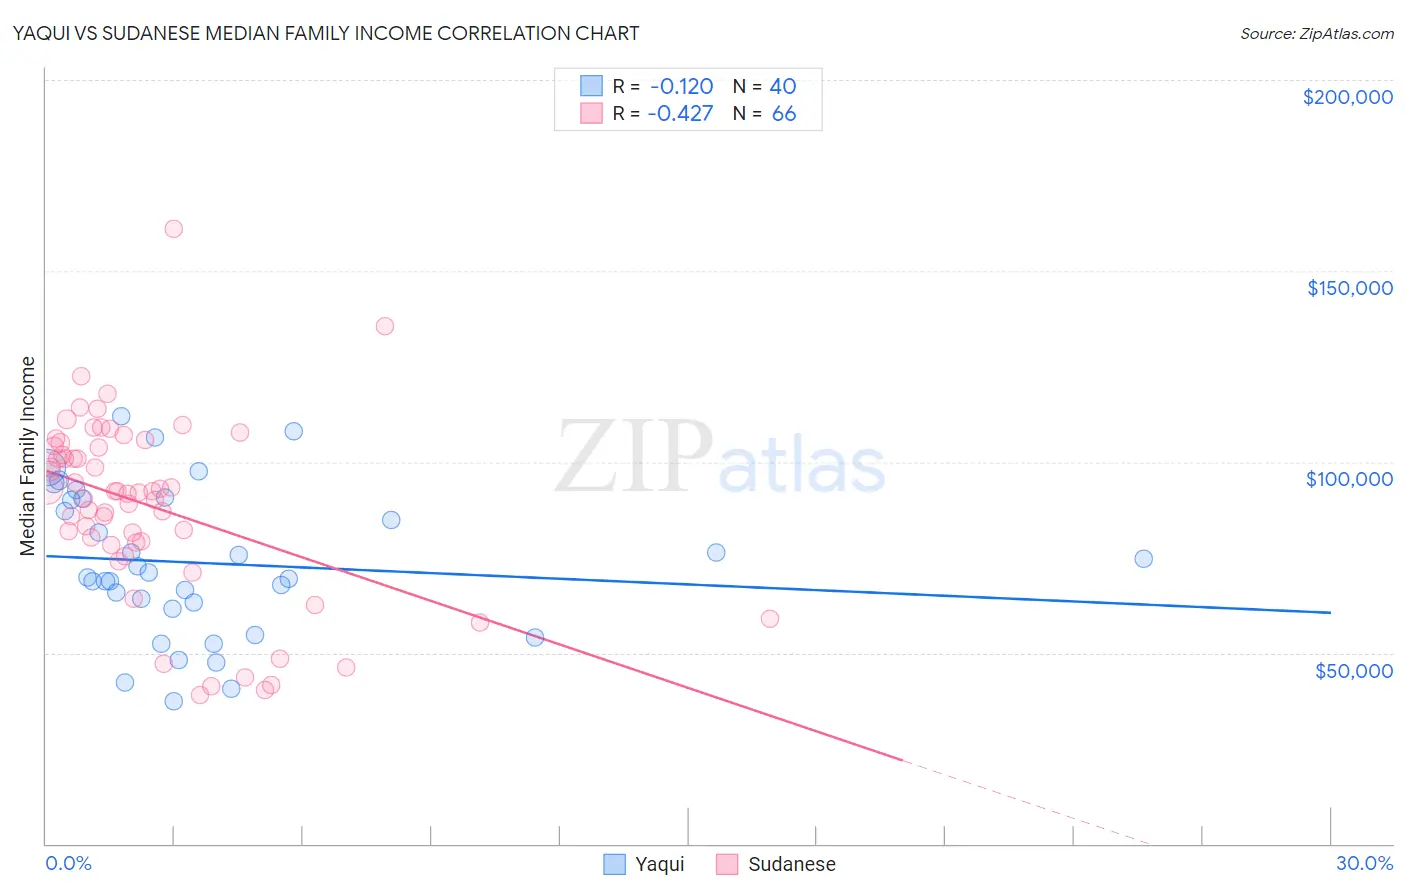
Yaqui vs Sudanese Median Family Income Correlation Chart
The statistical analysis conducted on geographies consisting of 107,704,504 people shows a poor negative correlation between the proportion of Yaqui and median family income in the United States with a correlation coefficient (R) of -0.120 and weighted average of $87,289. Similarly, the statistical analysis conducted on geographies consisting of 110,081,716 people shows a moderate negative correlation between the proportion of Sudanese and median family income in the United States with a correlation coefficient (R) of -0.427 and weighted average of $96,783, a difference of 10.9%.
Median Family Income Correlation Summary
| Measurement | Yaqui | Sudanese |
| Minimum | $37,174 | $38,840 |
| Maximum | $111,841 | $160,922 |
| Range | $74,667 | $122,082 |
| Mean | $73,462 | $88,541 |
| Median | $70,310 | $92,056 |
| Interquartile 25% (IQ1) | $62,336 | $78,776 |
| Interquartile 75% (IQ3) | $90,136 | $104,200 |
| Interquartile Range (IQR) | $27,800 | $25,424 |
| Standard Deviation (Sample) | $19,183 | $23,841 |
| Standard Deviation (Population) | $18,942 | $23,660 |
Similar Demographics by Median Family Income
Demographics Similar to Yaqui by Median Family Income
In terms of median family income, the demographic groups most similar to Yaqui are Fijian ($87,387, a difference of 0.11%), Immigrants from Guatemala ($87,191, a difference of 0.11%), Cajun ($87,157, a difference of 0.15%), Immigrants from Latin America ($86,989, a difference of 0.34%), and Ute ($87,596, a difference of 0.35%).
| Demographics | Rating | Rank | Median Family Income |
| Cherokee | 0.1 /100 | #288 | Tragic $88,209 |
| Central American Indians | 0.1 /100 | #289 | Tragic $88,034 |
| Shoshone | 0.1 /100 | #290 | Tragic $87,872 |
| Immigrants | Cabo Verde | 0.1 /100 | #291 | Tragic $87,830 |
| Africans | 0.1 /100 | #292 | Tragic $87,820 |
| Ute | 0.0 /100 | #293 | Tragic $87,596 |
| Fijians | 0.0 /100 | #294 | Tragic $87,387 |
| Yaqui | 0.0 /100 | #295 | Tragic $87,289 |
| Immigrants | Guatemala | 0.0 /100 | #296 | Tragic $87,191 |
| Cajuns | 0.0 /100 | #297 | Tragic $87,157 |
| Immigrants | Latin America | 0.0 /100 | #298 | Tragic $86,989 |
| Chippewa | 0.0 /100 | #299 | Tragic $86,852 |
| Ottawa | 0.0 /100 | #300 | Tragic $86,380 |
| Colville | 0.0 /100 | #301 | Tragic $85,792 |
| Spanish American Indians | 0.0 /100 | #302 | Tragic $85,728 |
Demographics Similar to Sudanese by Median Family Income
In terms of median family income, the demographic groups most similar to Sudanese are Delaware ($96,958, a difference of 0.18%), Immigrants from Ghana ($96,544, a difference of 0.25%), Immigrants from Nigeria ($96,439, a difference of 0.36%), Immigrants from Cambodia ($97,222, a difference of 0.45%), and Japanese ($97,288, a difference of 0.52%).
| Demographics | Rating | Rank | Median Family Income |
| Immigrants | Armenia | 7.0 /100 | #213 | Tragic $97,605 |
| Bermudans | 6.9 /100 | #214 | Tragic $97,577 |
| Nigerians | 6.7 /100 | #215 | Tragic $97,522 |
| Immigrants | Bosnia and Herzegovina | 6.4 /100 | #216 | Tragic $97,432 |
| Japanese | 6.0 /100 | #217 | Tragic $97,288 |
| Immigrants | Cambodia | 5.8 /100 | #218 | Tragic $97,222 |
| Delaware | 5.1 /100 | #219 | Tragic $96,958 |
| Sudanese | 4.7 /100 | #220 | Tragic $96,783 |
| Immigrants | Ghana | 4.2 /100 | #221 | Tragic $96,544 |
| Immigrants | Nigeria | 4.0 /100 | #222 | Tragic $96,439 |
| Venezuelans | 3.7 /100 | #223 | Tragic $96,281 |
| Immigrants | Nonimmigrants | 3.6 /100 | #224 | Tragic $96,231 |
| Vietnamese | 3.4 /100 | #225 | Tragic $96,123 |
| Immigrants | Panama | 2.7 /100 | #226 | Tragic $95,647 |
| Alaska Natives | 2.6 /100 | #227 | Tragic $95,573 |