Yaqui vs Cuban Median Family Income
COMPARE
Yaqui
Cuban
Median Family Income
Median Family Income Comparison
Yaqui
Cubans
$87,289
MEDIAN FAMILY INCOME
0.0/ 100
METRIC RATING
295th/ 347
METRIC RANK
$84,981
MEDIAN FAMILY INCOME
0.0/ 100
METRIC RATING
312th/ 347
METRIC RANK
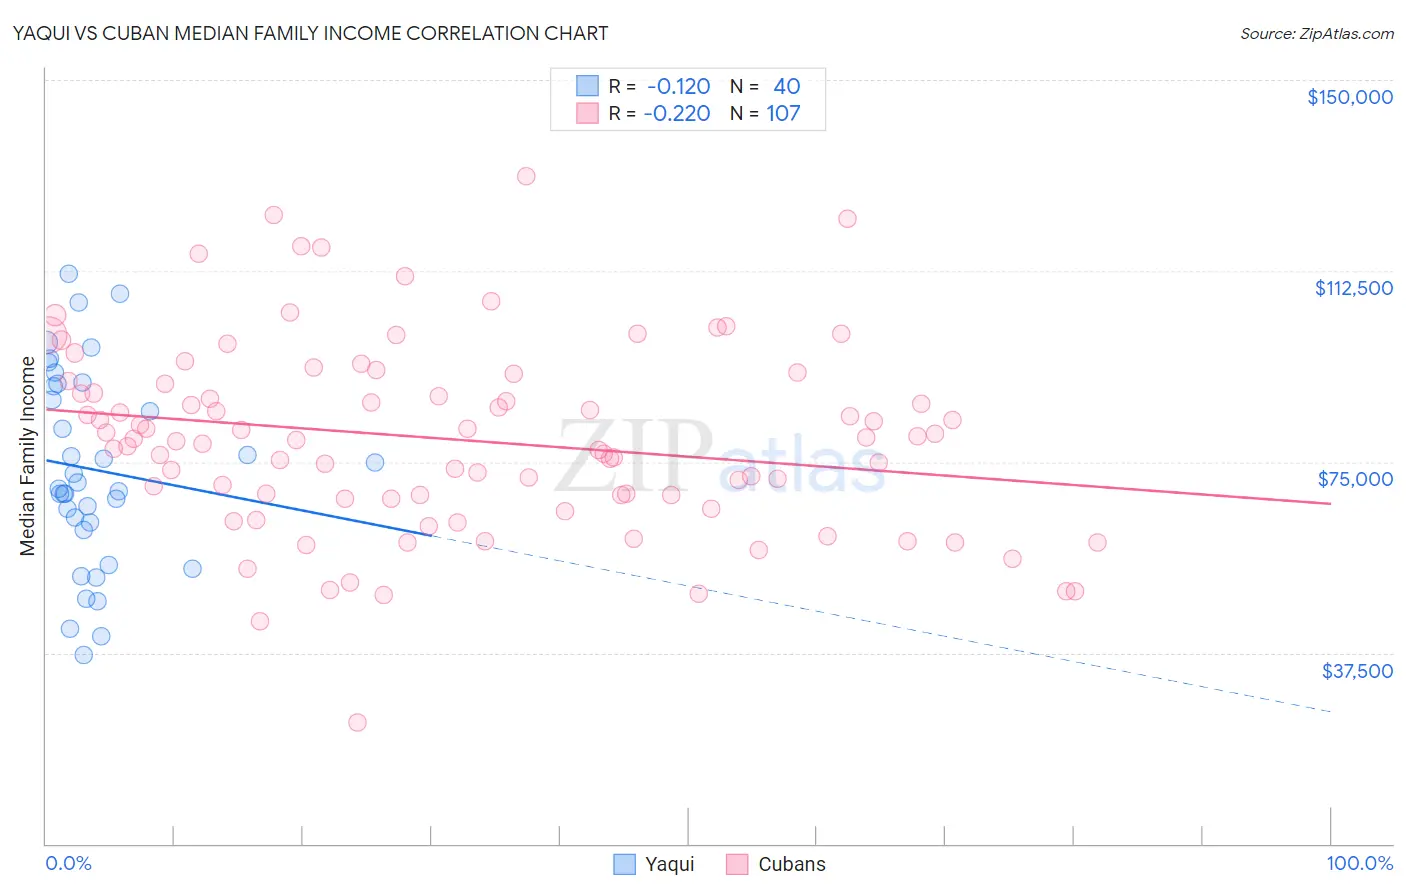
Yaqui vs Cuban Median Family Income Correlation Chart
The statistical analysis conducted on geographies consisting of 107,704,504 people shows a poor negative correlation between the proportion of Yaqui and median family income in the United States with a correlation coefficient (R) of -0.120 and weighted average of $87,289. Similarly, the statistical analysis conducted on geographies consisting of 448,691,327 people shows a weak negative correlation between the proportion of Cubans and median family income in the United States with a correlation coefficient (R) of -0.220 and weighted average of $84,981, a difference of 2.7%.
Median Family Income Correlation Summary
| Measurement | Yaqui | Cuban |
| Minimum | $37,174 | $23,750 |
| Maximum | $111,841 | $131,198 |
| Range | $74,667 | $107,448 |
| Mean | $73,462 | $79,388 |
| Median | $70,310 | $79,353 |
| Interquartile 25% (IQ1) | $62,336 | $67,815 |
| Interquartile 75% (IQ3) | $90,136 | $90,371 |
| Interquartile Range (IQR) | $27,800 | $22,555 |
| Standard Deviation (Sample) | $19,183 | $18,688 |
| Standard Deviation (Population) | $18,942 | $18,601 |
Demographics Similar to Yaqui and Cubans by Median Family Income
In terms of median family income, the demographic groups most similar to Yaqui are Fijian ($87,387, a difference of 0.11%), Immigrants from Guatemala ($87,191, a difference of 0.11%), Cajun ($87,157, a difference of 0.15%), Immigrants from Latin America ($86,989, a difference of 0.34%), and Ute ($87,596, a difference of 0.35%). Similarly, the demographic groups most similar to Cubans are Honduran ($85,004, a difference of 0.030%), Immigrants from Central America ($85,050, a difference of 0.080%), Choctaw ($84,835, a difference of 0.17%), Haitian ($85,218, a difference of 0.28%), and U.S. Virgin Islander ($85,294, a difference of 0.37%).
| Demographics | Rating | Rank | Median Family Income |
| Ute | 0.0 /100 | #293 | Tragic $87,596 |
| Fijians | 0.0 /100 | #294 | Tragic $87,387 |
| Yaqui | 0.0 /100 | #295 | Tragic $87,289 |
| Immigrants | Guatemala | 0.0 /100 | #296 | Tragic $87,191 |
| Cajuns | 0.0 /100 | #297 | Tragic $87,157 |
| Immigrants | Latin America | 0.0 /100 | #298 | Tragic $86,989 |
| Chippewa | 0.0 /100 | #299 | Tragic $86,852 |
| Ottawa | 0.0 /100 | #300 | Tragic $86,380 |
| Colville | 0.0 /100 | #301 | Tragic $85,792 |
| Spanish American Indians | 0.0 /100 | #302 | Tragic $85,728 |
| Hispanics or Latinos | 0.0 /100 | #303 | Tragic $85,647 |
| Mexicans | 0.0 /100 | #304 | Tragic $85,618 |
| Paiute | 0.0 /100 | #305 | Tragic $85,414 |
| Immigrants | Dominica | 0.0 /100 | #306 | Tragic $85,411 |
| Chickasaw | 0.0 /100 | #307 | Tragic $85,356 |
| U.S. Virgin Islanders | 0.0 /100 | #308 | Tragic $85,294 |
| Haitians | 0.0 /100 | #309 | Tragic $85,218 |
| Immigrants | Central America | 0.0 /100 | #310 | Tragic $85,050 |
| Hondurans | 0.0 /100 | #311 | Tragic $85,004 |
| Cubans | 0.0 /100 | #312 | Tragic $84,981 |
| Choctaw | 0.0 /100 | #313 | Tragic $84,835 |