Yaqui vs Immigrants from Laos Median Family Income
COMPARE
Yaqui
Immigrants from Laos
Median Family Income
Median Family Income Comparison
Yaqui
Immigrants from Laos
$87,289
MEDIAN FAMILY INCOME
0.0/ 100
METRIC RATING
295th/ 347
METRIC RANK
$92,239
MEDIAN FAMILY INCOME
0.5/ 100
METRIC RATING
255th/ 347
METRIC RANK
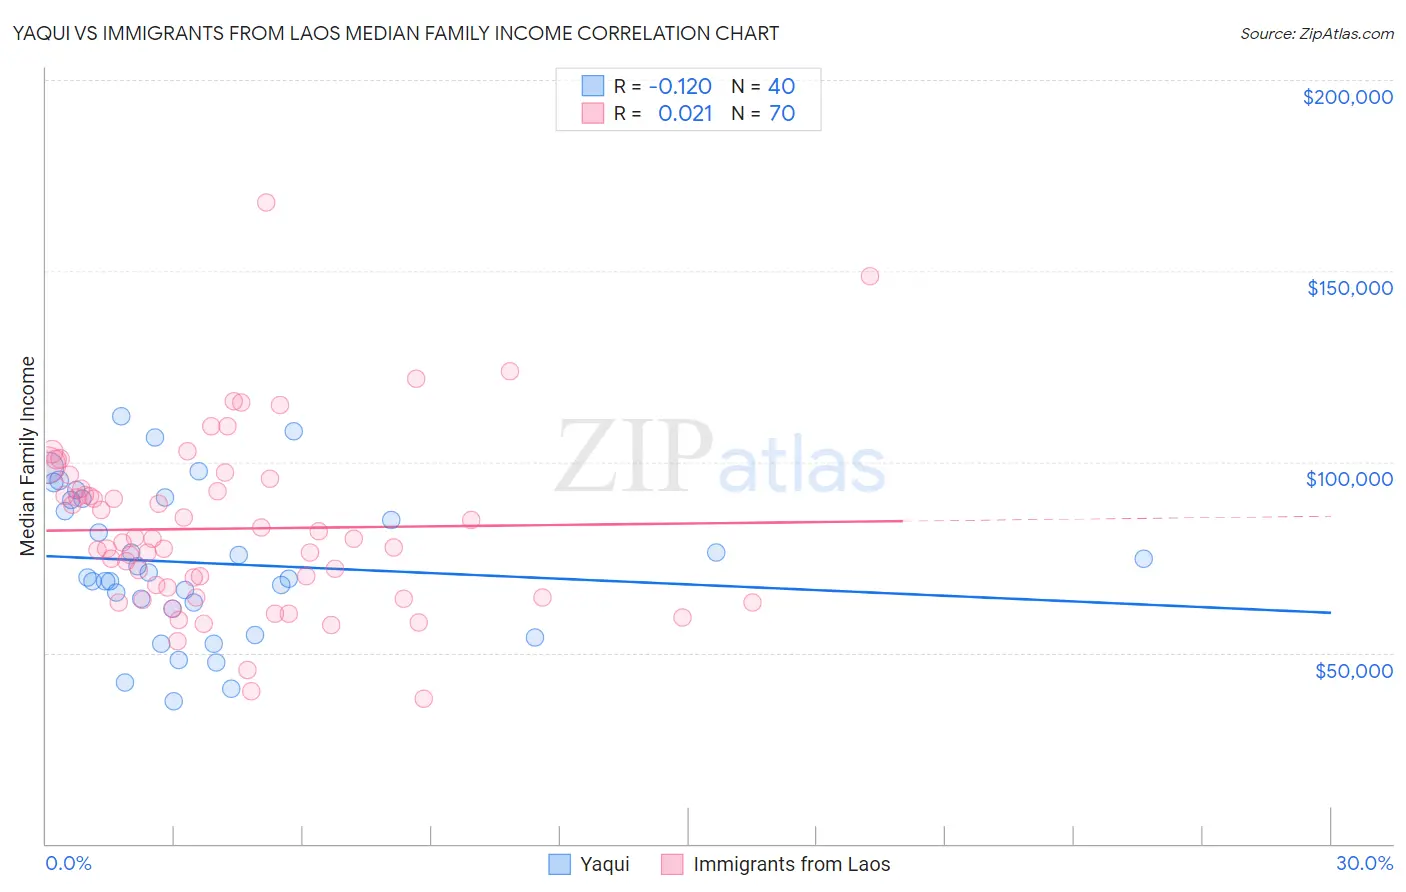
Yaqui vs Immigrants from Laos Median Family Income Correlation Chart
The statistical analysis conducted on geographies consisting of 107,704,504 people shows a poor negative correlation between the proportion of Yaqui and median family income in the United States with a correlation coefficient (R) of -0.120 and weighted average of $87,289. Similarly, the statistical analysis conducted on geographies consisting of 201,460,525 people shows no correlation between the proportion of Immigrants from Laos and median family income in the United States with a correlation coefficient (R) of 0.021 and weighted average of $92,239, a difference of 5.7%.
Median Family Income Correlation Summary
| Measurement | Yaqui | Immigrants from Laos |
| Minimum | $37,174 | $38,021 |
| Maximum | $111,841 | $167,827 |
| Range | $74,667 | $129,806 |
| Mean | $73,462 | $82,539 |
| Median | $70,310 | $79,366 |
| Interquartile 25% (IQ1) | $62,336 | $64,523 |
| Interquartile 75% (IQ3) | $90,136 | $93,010 |
| Interquartile Range (IQR) | $27,800 | $28,486 |
| Standard Deviation (Sample) | $19,183 | $23,089 |
| Standard Deviation (Population) | $18,942 | $22,924 |
Similar Demographics by Median Family Income
Demographics Similar to Yaqui by Median Family Income
In terms of median family income, the demographic groups most similar to Yaqui are Fijian ($87,387, a difference of 0.11%), Immigrants from Guatemala ($87,191, a difference of 0.11%), Cajun ($87,157, a difference of 0.15%), Immigrants from Latin America ($86,989, a difference of 0.34%), and Ute ($87,596, a difference of 0.35%).
| Demographics | Rating | Rank | Median Family Income |
| Cherokee | 0.1 /100 | #288 | Tragic $88,209 |
| Central American Indians | 0.1 /100 | #289 | Tragic $88,034 |
| Shoshone | 0.1 /100 | #290 | Tragic $87,872 |
| Immigrants | Cabo Verde | 0.1 /100 | #291 | Tragic $87,830 |
| Africans | 0.1 /100 | #292 | Tragic $87,820 |
| Ute | 0.0 /100 | #293 | Tragic $87,596 |
| Fijians | 0.0 /100 | #294 | Tragic $87,387 |
| Yaqui | 0.0 /100 | #295 | Tragic $87,289 |
| Immigrants | Guatemala | 0.0 /100 | #296 | Tragic $87,191 |
| Cajuns | 0.0 /100 | #297 | Tragic $87,157 |
| Immigrants | Latin America | 0.0 /100 | #298 | Tragic $86,989 |
| Chippewa | 0.0 /100 | #299 | Tragic $86,852 |
| Ottawa | 0.0 /100 | #300 | Tragic $86,380 |
| Colville | 0.0 /100 | #301 | Tragic $85,792 |
| Spanish American Indians | 0.0 /100 | #302 | Tragic $85,728 |
Demographics Similar to Immigrants from Laos by Median Family Income
In terms of median family income, the demographic groups most similar to Immigrants from Laos are Nicaraguan ($92,231, a difference of 0.010%), American ($92,096, a difference of 0.16%), Immigrants from Barbados ($92,419, a difference of 0.20%), Immigrants from Guyana ($92,513, a difference of 0.30%), and Immigrants from El Salvador ($92,545, a difference of 0.33%).
| Demographics | Rating | Rank | Median Family Income |
| French American Indians | 0.7 /100 | #248 | Tragic $92,872 |
| Immigrants | Ecuador | 0.7 /100 | #249 | Tragic $92,837 |
| West Indians | 0.6 /100 | #250 | Tragic $92,765 |
| Immigrants | Somalia | 0.6 /100 | #251 | Tragic $92,609 |
| Immigrants | El Salvador | 0.6 /100 | #252 | Tragic $92,545 |
| Immigrants | Guyana | 0.6 /100 | #253 | Tragic $92,513 |
| Immigrants | Barbados | 0.5 /100 | #254 | Tragic $92,419 |
| Immigrants | Laos | 0.5 /100 | #255 | Tragic $92,239 |
| Nicaraguans | 0.5 /100 | #256 | Tragic $92,231 |
| Americans | 0.4 /100 | #257 | Tragic $92,096 |
| Osage | 0.4 /100 | #258 | Tragic $91,926 |
| Cape Verdeans | 0.4 /100 | #259 | Tragic $91,848 |
| Pennsylvania Germans | 0.4 /100 | #260 | Tragic $91,763 |
| Inupiat | 0.4 /100 | #261 | Tragic $91,730 |
| Liberians | 0.4 /100 | #262 | Tragic $91,722 |