Yaqui vs Immigrants from West Indies Child Poverty Among Boys Under 16
COMPARE
Yaqui
Immigrants from West Indies
Child Poverty Among Boys Under 16
Child Poverty Among Boys Under 16 Comparison
Yaqui
Immigrants from West Indies
20.7%
CHILD POVERTY AMONG BOYS UNDER 16
0.0/ 100
METRIC RATING
292nd/ 347
METRIC RANK
20.0%
CHILD POVERTY AMONG BOYS UNDER 16
0.0/ 100
METRIC RATING
278th/ 347
METRIC RANK
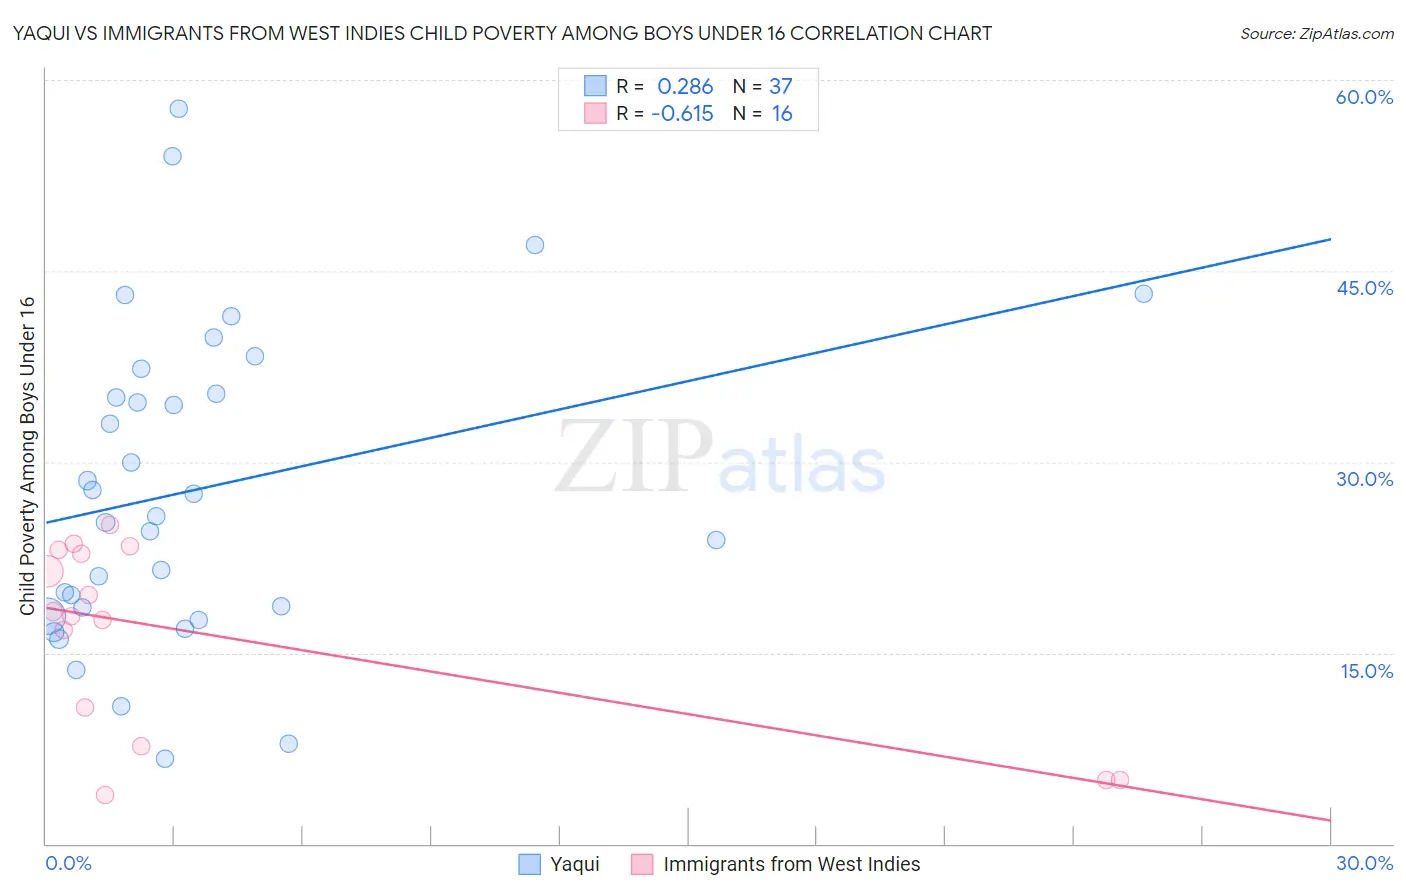
Yaqui vs Immigrants from West Indies Child Poverty Among Boys Under 16 Correlation Chart
The statistical analysis conducted on geographies consisting of 107,428,472 people shows a weak positive correlation between the proportion of Yaqui and poverty level among boys under the age of 16 in the United States with a correlation coefficient (R) of 0.286 and weighted average of 20.7%. Similarly, the statistical analysis conducted on geographies consisting of 72,283,837 people shows a significant negative correlation between the proportion of Immigrants from West Indies and poverty level among boys under the age of 16 in the United States with a correlation coefficient (R) of -0.615 and weighted average of 20.0%, a difference of 3.4%.
Child Poverty Among Boys Under 16 Correlation Summary
| Measurement | Yaqui | Immigrants from West Indies |
| Minimum | 6.7% | 3.9% |
| Maximum | 57.8% | 25.1% |
| Range | 51.1% | 21.2% |
| Mean | 27.9% | 16.3% |
| Median | 25.7% | 18.0% |
| Interquartile 25% (IQ1) | 18.2% | 9.2% |
| Interquartile 75% (IQ3) | 36.3% | 22.9% |
| Interquartile Range (IQR) | 18.1% | 13.8% |
| Standard Deviation (Sample) | 12.4% | 7.4% |
| Standard Deviation (Population) | 12.2% | 7.2% |
Demographics Similar to Yaqui and Immigrants from West Indies by Child Poverty Among Boys Under 16
In terms of child poverty among boys under 16, the demographic groups most similar to Yaqui are Immigrants from Senegal (20.7%, a difference of 0.010%), Immigrants from Bahamas (20.7%, a difference of 0.13%), Mexican (20.7%, a difference of 0.25%), Immigrants from Latin America (20.6%, a difference of 0.26%), and Senegalese (20.6%, a difference of 0.70%). Similarly, the demographic groups most similar to Immigrants from West Indies are Immigrants from Barbados (20.0%, a difference of 0.020%), Subsaharan African (20.0%, a difference of 0.12%), Bangladeshi (20.0%, a difference of 0.13%), Central American (20.1%, a difference of 0.25%), and Jamaican (20.0%, a difference of 0.29%).
| Demographics | Rating | Rank | Child Poverty Among Boys Under 16 |
| Jamaicans | 0.0 /100 | #275 | Tragic 20.0% |
| Sub-Saharan Africans | 0.0 /100 | #276 | Tragic 20.0% |
| Immigrants | Barbados | 0.0 /100 | #277 | Tragic 20.0% |
| Immigrants | West Indies | 0.0 /100 | #278 | Tragic 20.0% |
| Bangladeshis | 0.0 /100 | #279 | Tragic 20.0% |
| Central Americans | 0.0 /100 | #280 | Tragic 20.1% |
| Immigrants | Zaire | 0.0 /100 | #281 | Tragic 20.1% |
| Comanche | 0.0 /100 | #282 | Tragic 20.1% |
| Immigrants | Jamaica | 0.0 /100 | #283 | Tragic 20.1% |
| Barbadians | 0.0 /100 | #284 | Tragic 20.2% |
| Arapaho | 0.0 /100 | #285 | Tragic 20.2% |
| West Indians | 0.0 /100 | #286 | Tragic 20.3% |
| Immigrants | Belize | 0.0 /100 | #287 | Tragic 20.3% |
| Immigrants | St. Vincent and the Grenadines | 0.0 /100 | #288 | Tragic 20.3% |
| Blackfeet | 0.0 /100 | #289 | Tragic 20.4% |
| Senegalese | 0.0 /100 | #290 | Tragic 20.6% |
| Immigrants | Latin America | 0.0 /100 | #291 | Tragic 20.6% |
| Yaqui | 0.0 /100 | #292 | Tragic 20.7% |
| Immigrants | Senegal | 0.0 /100 | #293 | Tragic 20.7% |
| Immigrants | Bahamas | 0.0 /100 | #294 | Tragic 20.7% |
| Mexicans | 0.0 /100 | #295 | Tragic 20.7% |