Yaqui vs Immigrants from Armenia Median Family Income
COMPARE
Yaqui
Immigrants from Armenia
Median Family Income
Median Family Income Comparison
Yaqui
Immigrants from Armenia
$87,289
MEDIAN FAMILY INCOME
0.0/ 100
METRIC RATING
295th/ 347
METRIC RANK
$97,605
MEDIAN FAMILY INCOME
7.0/ 100
METRIC RATING
213th/ 347
METRIC RANK
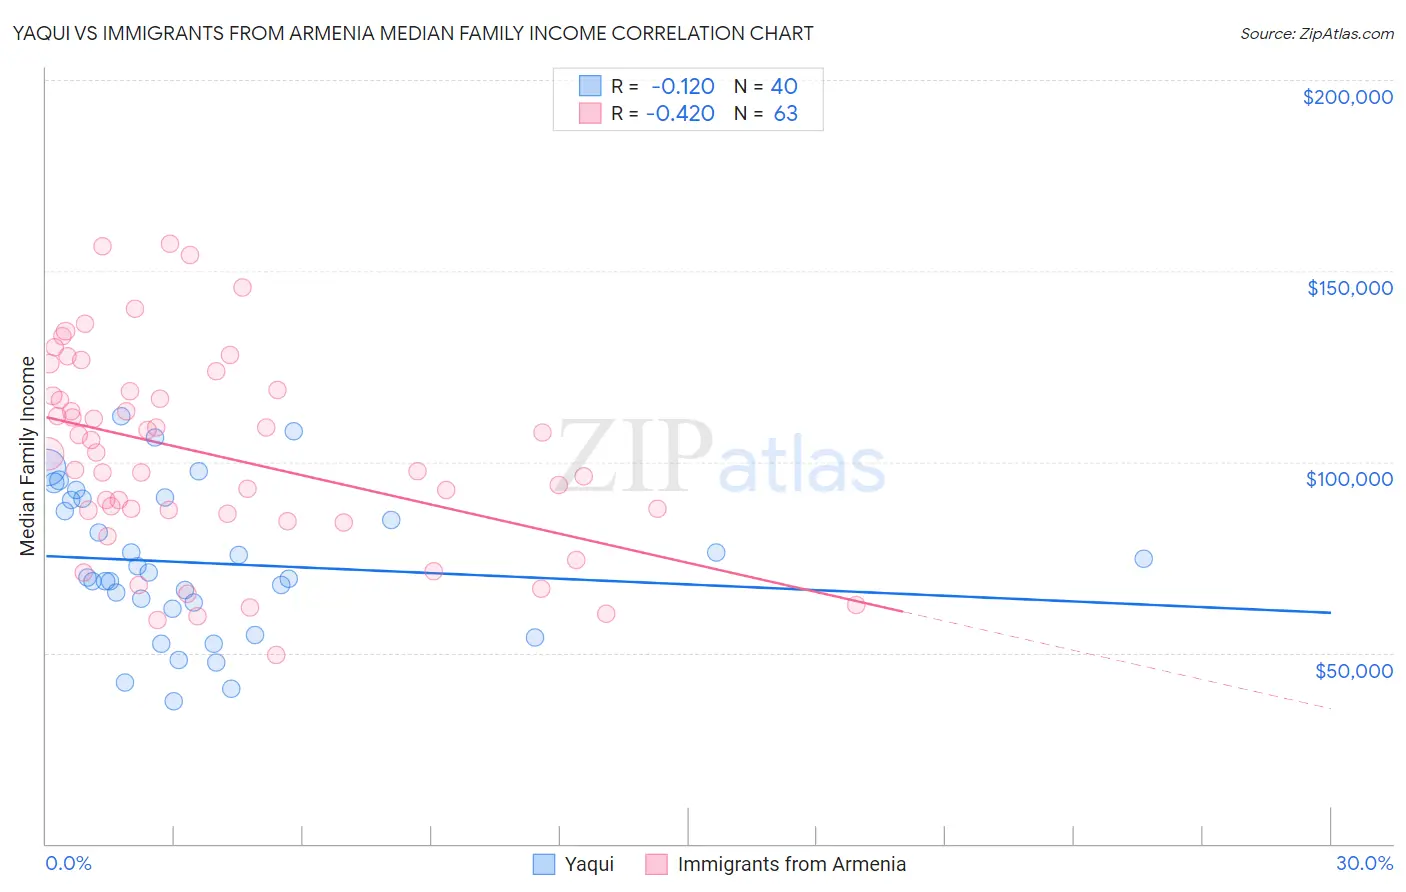
Yaqui vs Immigrants from Armenia Median Family Income Correlation Chart
The statistical analysis conducted on geographies consisting of 107,704,504 people shows a poor negative correlation between the proportion of Yaqui and median family income in the United States with a correlation coefficient (R) of -0.120 and weighted average of $87,289. Similarly, the statistical analysis conducted on geographies consisting of 97,713,870 people shows a moderate negative correlation between the proportion of Immigrants from Armenia and median family income in the United States with a correlation coefficient (R) of -0.420 and weighted average of $97,605, a difference of 11.8%.
Median Family Income Correlation Summary
| Measurement | Yaqui | Immigrants from Armenia |
| Minimum | $37,174 | $49,583 |
| Maximum | $111,841 | $157,199 |
| Range | $74,667 | $107,616 |
| Mean | $73,462 | $101,713 |
| Median | $70,310 | $102,061 |
| Interquartile 25% (IQ1) | $62,336 | $86,292 |
| Interquartile 75% (IQ3) | $90,136 | $118,550 |
| Interquartile Range (IQR) | $27,800 | $32,258 |
| Standard Deviation (Sample) | $19,183 | $25,932 |
| Standard Deviation (Population) | $18,942 | $25,725 |
Similar Demographics by Median Family Income
Demographics Similar to Yaqui by Median Family Income
In terms of median family income, the demographic groups most similar to Yaqui are Fijian ($87,387, a difference of 0.11%), Immigrants from Guatemala ($87,191, a difference of 0.11%), Cajun ($87,157, a difference of 0.15%), Immigrants from Latin America ($86,989, a difference of 0.34%), and Ute ($87,596, a difference of 0.35%).
| Demographics | Rating | Rank | Median Family Income |
| Cherokee | 0.1 /100 | #288 | Tragic $88,209 |
| Central American Indians | 0.1 /100 | #289 | Tragic $88,034 |
| Shoshone | 0.1 /100 | #290 | Tragic $87,872 |
| Immigrants | Cabo Verde | 0.1 /100 | #291 | Tragic $87,830 |
| Africans | 0.1 /100 | #292 | Tragic $87,820 |
| Ute | 0.0 /100 | #293 | Tragic $87,596 |
| Fijians | 0.0 /100 | #294 | Tragic $87,387 |
| Yaqui | 0.0 /100 | #295 | Tragic $87,289 |
| Immigrants | Guatemala | 0.0 /100 | #296 | Tragic $87,191 |
| Cajuns | 0.0 /100 | #297 | Tragic $87,157 |
| Immigrants | Latin America | 0.0 /100 | #298 | Tragic $86,989 |
| Chippewa | 0.0 /100 | #299 | Tragic $86,852 |
| Ottawa | 0.0 /100 | #300 | Tragic $86,380 |
| Colville | 0.0 /100 | #301 | Tragic $85,792 |
| Spanish American Indians | 0.0 /100 | #302 | Tragic $85,728 |
Demographics Similar to Immigrants from Armenia by Median Family Income
In terms of median family income, the demographic groups most similar to Immigrants from Armenia are Bermudan ($97,577, a difference of 0.030%), Panamanian ($97,683, a difference of 0.080%), Nigerian ($97,522, a difference of 0.090%), Immigrants from Sudan ($97,737, a difference of 0.13%), and Immigrants from Bosnia and Herzegovina ($97,432, a difference of 0.18%).
| Demographics | Rating | Rank | Median Family Income |
| Immigrants | Iraq | 12.1 /100 | #206 | Poor $98,786 |
| Aleuts | 11.6 /100 | #207 | Poor $98,702 |
| Immigrants | Uruguay | 9.2 /100 | #208 | Tragic $98,205 |
| Immigrants | Colombia | 8.7 /100 | #209 | Tragic $98,067 |
| Puget Sound Salish | 8.2 /100 | #210 | Tragic $97,958 |
| Immigrants | Sudan | 7.4 /100 | #211 | Tragic $97,737 |
| Panamanians | 7.2 /100 | #212 | Tragic $97,683 |
| Immigrants | Armenia | 7.0 /100 | #213 | Tragic $97,605 |
| Bermudans | 6.9 /100 | #214 | Tragic $97,577 |
| Nigerians | 6.7 /100 | #215 | Tragic $97,522 |
| Immigrants | Bosnia and Herzegovina | 6.4 /100 | #216 | Tragic $97,432 |
| Japanese | 6.0 /100 | #217 | Tragic $97,288 |
| Immigrants | Cambodia | 5.8 /100 | #218 | Tragic $97,222 |
| Delaware | 5.1 /100 | #219 | Tragic $96,958 |
| Sudanese | 4.7 /100 | #220 | Tragic $96,783 |