Trinidadian and Tobagonian vs Immigrants from Laos Median Family Income
COMPARE
Trinidadian and Tobagonian
Immigrants from Laos
Median Family Income
Median Family Income Comparison
Trinidadians and Tobagonians
Immigrants from Laos
$94,466
MEDIAN FAMILY INCOME
1.5/ 100
METRIC RATING
236th/ 347
METRIC RANK
$92,239
MEDIAN FAMILY INCOME
0.5/ 100
METRIC RATING
255th/ 347
METRIC RANK
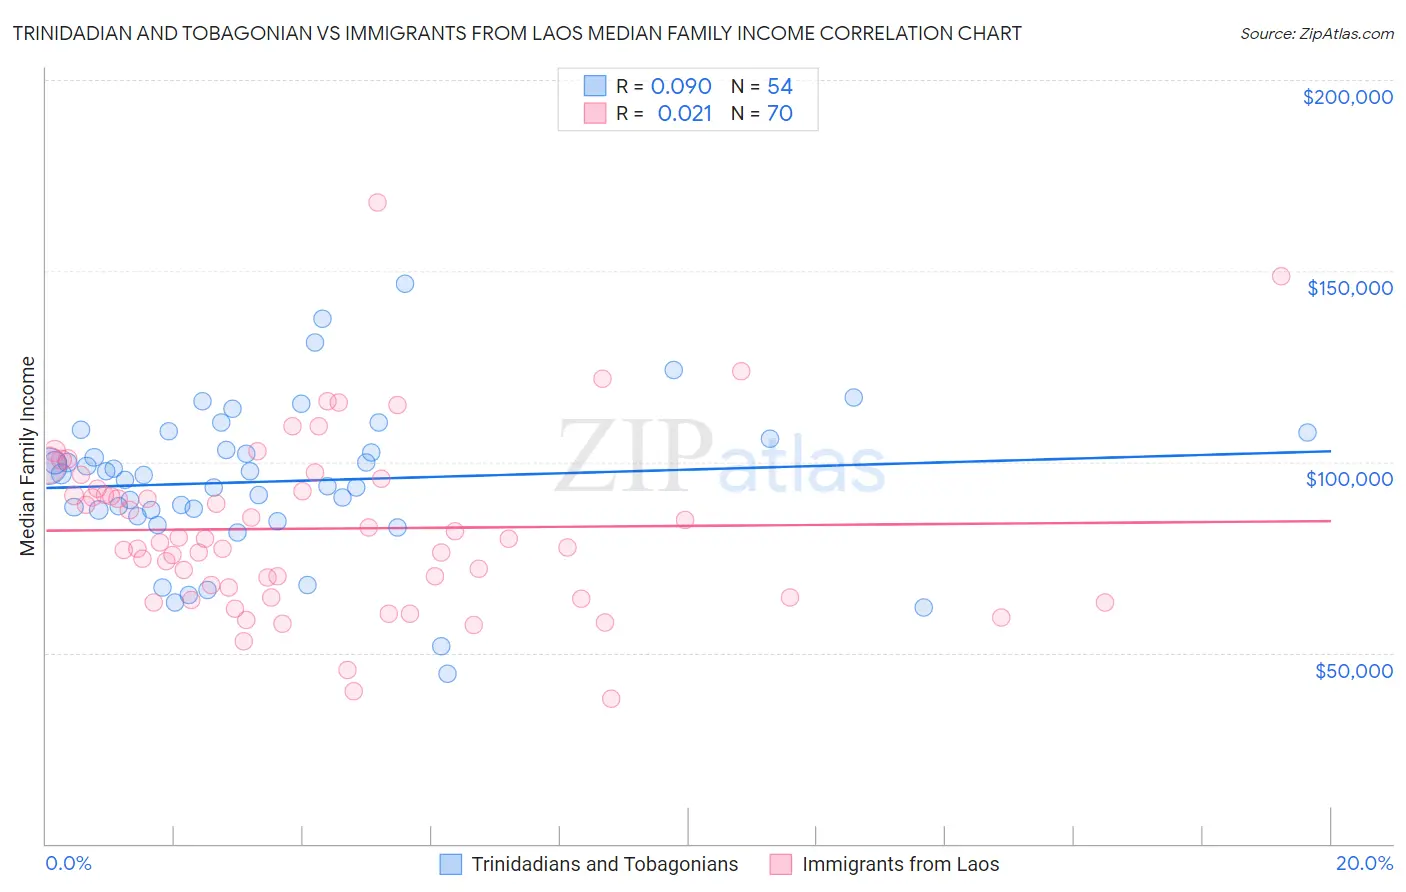
Trinidadian and Tobagonian vs Immigrants from Laos Median Family Income Correlation Chart
The statistical analysis conducted on geographies consisting of 219,638,345 people shows a slight positive correlation between the proportion of Trinidadians and Tobagonians and median family income in the United States with a correlation coefficient (R) of 0.090 and weighted average of $94,466. Similarly, the statistical analysis conducted on geographies consisting of 201,460,525 people shows no correlation between the proportion of Immigrants from Laos and median family income in the United States with a correlation coefficient (R) of 0.021 and weighted average of $92,239, a difference of 2.4%.
Median Family Income Correlation Summary
| Measurement | Trinidadian and Tobagonian | Immigrants from Laos |
| Minimum | $44,583 | $38,021 |
| Maximum | $146,767 | $167,827 |
| Range | $102,184 | $129,806 |
| Mean | $94,928 | $82,539 |
| Median | $96,651 | $79,366 |
| Interquartile 25% (IQ1) | $87,494 | $64,523 |
| Interquartile 75% (IQ3) | $106,050 | $93,010 |
| Interquartile Range (IQR) | $18,556 | $28,486 |
| Standard Deviation (Sample) | $19,692 | $23,089 |
| Standard Deviation (Population) | $19,508 | $22,924 |
Demographics Similar to Trinidadians and Tobagonians and Immigrants from Laos by Median Family Income
In terms of median family income, the demographic groups most similar to Trinidadians and Tobagonians are Immigrants from Burma/Myanmar ($94,472, a difference of 0.010%), Alaskan Athabascan ($94,429, a difference of 0.040%), Nepalese ($94,153, a difference of 0.33%), Salvadoran ($94,109, a difference of 0.38%), and Somali ($94,085, a difference of 0.40%). Similarly, the demographic groups most similar to Immigrants from Laos are Immigrants from Barbados ($92,419, a difference of 0.20%), Immigrants from Guyana ($92,513, a difference of 0.30%), Immigrants from El Salvador ($92,545, a difference of 0.33%), Immigrants from Somalia ($92,609, a difference of 0.40%), and West Indian ($92,765, a difference of 0.57%).
| Demographics | Rating | Rank | Median Family Income |
| Immigrants | Burma/Myanmar | 1.5 /100 | #235 | Tragic $94,472 |
| Trinidadians and Tobagonians | 1.5 /100 | #236 | Tragic $94,466 |
| Alaskan Athabascans | 1.5 /100 | #237 | Tragic $94,429 |
| Nepalese | 1.3 /100 | #238 | Tragic $94,153 |
| Salvadorans | 1.2 /100 | #239 | Tragic $94,109 |
| Somalis | 1.2 /100 | #240 | Tragic $94,085 |
| Immigrants | Trinidad and Tobago | 1.2 /100 | #241 | Tragic $93,988 |
| Barbadians | 1.1 /100 | #242 | Tragic $93,919 |
| German Russians | 1.1 /100 | #243 | Tragic $93,858 |
| Sub-Saharan Africans | 1.0 /100 | #244 | Tragic $93,748 |
| Immigrants | Middle Africa | 1.0 /100 | #245 | Tragic $93,593 |
| Guyanese | 0.9 /100 | #246 | Tragic $93,373 |
| Immigrants | Senegal | 0.7 /100 | #247 | Tragic $92,912 |
| French American Indians | 0.7 /100 | #248 | Tragic $92,872 |
| Immigrants | Ecuador | 0.7 /100 | #249 | Tragic $92,837 |
| West Indians | 0.6 /100 | #250 | Tragic $92,765 |
| Immigrants | Somalia | 0.6 /100 | #251 | Tragic $92,609 |
| Immigrants | El Salvador | 0.6 /100 | #252 | Tragic $92,545 |
| Immigrants | Guyana | 0.6 /100 | #253 | Tragic $92,513 |
| Immigrants | Barbados | 0.5 /100 | #254 | Tragic $92,419 |
| Immigrants | Laos | 0.5 /100 | #255 | Tragic $92,239 |