Welsh vs Immigrants from Laos Median Family Income
COMPARE
Welsh
Immigrants from Laos
Median Family Income
Median Family Income Comparison
Welsh
Immigrants from Laos
$102,151
MEDIAN FAMILY INCOME
43.3/ 100
METRIC RATING
178th/ 347
METRIC RANK
$92,239
MEDIAN FAMILY INCOME
0.5/ 100
METRIC RATING
255th/ 347
METRIC RANK
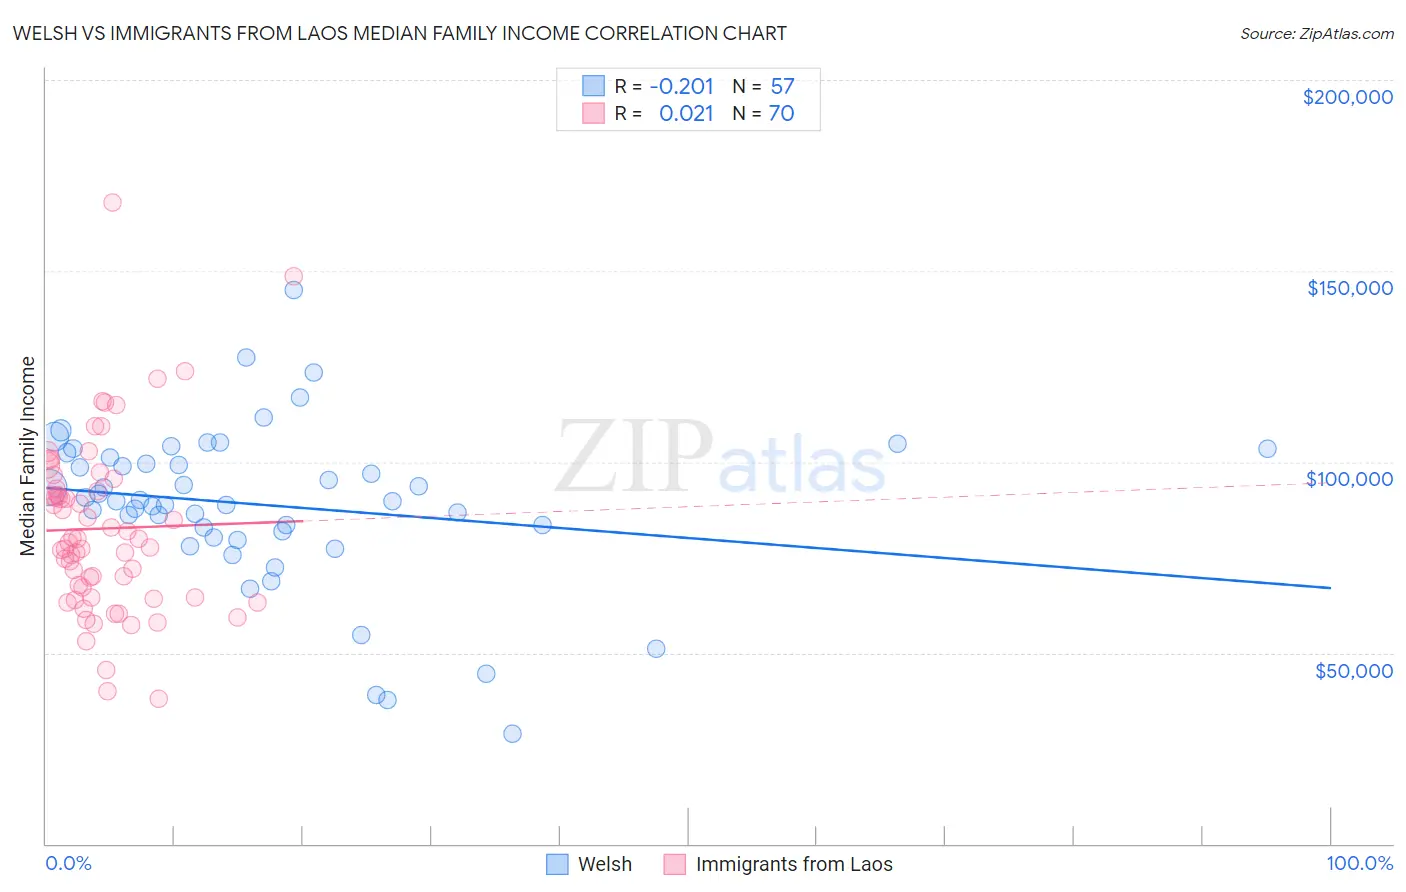
Welsh vs Immigrants from Laos Median Family Income Correlation Chart
The statistical analysis conducted on geographies consisting of 527,824,493 people shows a weak negative correlation between the proportion of Welsh and median family income in the United States with a correlation coefficient (R) of -0.201 and weighted average of $102,151. Similarly, the statistical analysis conducted on geographies consisting of 201,460,525 people shows no correlation between the proportion of Immigrants from Laos and median family income in the United States with a correlation coefficient (R) of 0.021 and weighted average of $92,239, a difference of 10.7%.
Median Family Income Correlation Summary
| Measurement | Welsh | Immigrants from Laos |
| Minimum | $28,750 | $38,021 |
| Maximum | $145,055 | $167,827 |
| Range | $116,305 | $129,806 |
| Mean | $88,686 | $82,539 |
| Median | $89,832 | $79,366 |
| Interquartile 25% (IQ1) | $80,992 | $64,523 |
| Interquartile 75% (IQ3) | $101,775 | $93,010 |
| Interquartile Range (IQR) | $20,783 | $28,486 |
| Standard Deviation (Sample) | $21,326 | $23,089 |
| Standard Deviation (Population) | $21,138 | $22,924 |
Similar Demographics by Median Family Income
Demographics Similar to Welsh by Median Family Income
In terms of median family income, the demographic groups most similar to Welsh are German ($102,254, a difference of 0.10%), French ($102,368, a difference of 0.21%), Immigrants from Eastern Africa ($102,451, a difference of 0.29%), South American ($101,856, a difference of 0.29%), and Finnish ($102,676, a difference of 0.51%).
| Demographics | Rating | Rank | Median Family Income |
| Alsatians | 54.3 /100 | #171 | Average $103,010 |
| Immigrants | Eritrea | 51.9 /100 | #172 | Average $102,823 |
| Belgians | 51.4 /100 | #173 | Average $102,788 |
| Finns | 50.0 /100 | #174 | Average $102,676 |
| Immigrants | Eastern Africa | 47.1 /100 | #175 | Average $102,451 |
| French | 46.1 /100 | #176 | Average $102,368 |
| Germans | 44.6 /100 | #177 | Average $102,254 |
| Welsh | 43.3 /100 | #178 | Average $102,151 |
| South Americans | 39.7 /100 | #179 | Fair $101,856 |
| French Canadians | 37.0 /100 | #180 | Fair $101,634 |
| Spaniards | 36.8 /100 | #181 | Fair $101,617 |
| Tsimshian | 35.9 /100 | #182 | Fair $101,543 |
| Kenyans | 34.5 /100 | #183 | Fair $101,417 |
| Immigrants | Costa Rica | 33.7 /100 | #184 | Fair $101,354 |
| Dutch | 31.9 /100 | #185 | Fair $101,192 |
Demographics Similar to Immigrants from Laos by Median Family Income
In terms of median family income, the demographic groups most similar to Immigrants from Laos are Nicaraguan ($92,231, a difference of 0.010%), American ($92,096, a difference of 0.16%), Immigrants from Barbados ($92,419, a difference of 0.20%), Immigrants from Guyana ($92,513, a difference of 0.30%), and Immigrants from El Salvador ($92,545, a difference of 0.33%).
| Demographics | Rating | Rank | Median Family Income |
| French American Indians | 0.7 /100 | #248 | Tragic $92,872 |
| Immigrants | Ecuador | 0.7 /100 | #249 | Tragic $92,837 |
| West Indians | 0.6 /100 | #250 | Tragic $92,765 |
| Immigrants | Somalia | 0.6 /100 | #251 | Tragic $92,609 |
| Immigrants | El Salvador | 0.6 /100 | #252 | Tragic $92,545 |
| Immigrants | Guyana | 0.6 /100 | #253 | Tragic $92,513 |
| Immigrants | Barbados | 0.5 /100 | #254 | Tragic $92,419 |
| Immigrants | Laos | 0.5 /100 | #255 | Tragic $92,239 |
| Nicaraguans | 0.5 /100 | #256 | Tragic $92,231 |
| Americans | 0.4 /100 | #257 | Tragic $92,096 |
| Osage | 0.4 /100 | #258 | Tragic $91,926 |
| Cape Verdeans | 0.4 /100 | #259 | Tragic $91,848 |
| Pennsylvania Germans | 0.4 /100 | #260 | Tragic $91,763 |
| Inupiat | 0.4 /100 | #261 | Tragic $91,730 |
| Liberians | 0.4 /100 | #262 | Tragic $91,722 |