Honduran vs Immigrants from Laos Median Family Income
COMPARE
Honduran
Immigrants from Laos
Median Family Income
Median Family Income Comparison
Hondurans
Immigrants from Laos
$85,004
MEDIAN FAMILY INCOME
0.0/ 100
METRIC RATING
311th/ 347
METRIC RANK
$92,239
MEDIAN FAMILY INCOME
0.5/ 100
METRIC RATING
255th/ 347
METRIC RANK
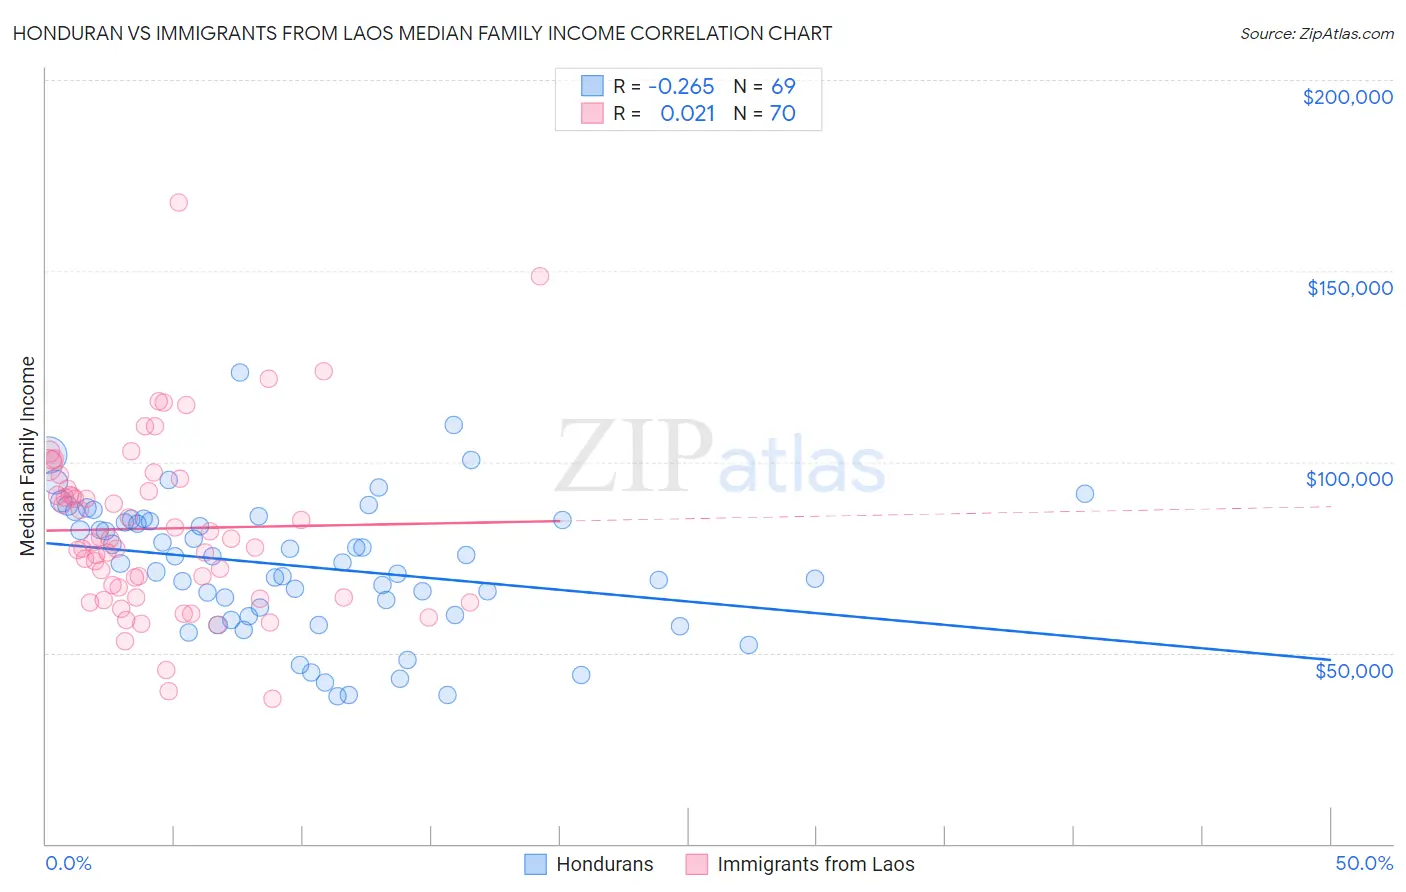
Honduran vs Immigrants from Laos Median Family Income Correlation Chart
The statistical analysis conducted on geographies consisting of 357,506,155 people shows a weak negative correlation between the proportion of Hondurans and median family income in the United States with a correlation coefficient (R) of -0.265 and weighted average of $85,004. Similarly, the statistical analysis conducted on geographies consisting of 201,460,525 people shows no correlation between the proportion of Immigrants from Laos and median family income in the United States with a correlation coefficient (R) of 0.021 and weighted average of $92,239, a difference of 8.5%.
Median Family Income Correlation Summary
| Measurement | Honduran | Immigrants from Laos |
| Minimum | $38,552 | $38,021 |
| Maximum | $123,311 | $167,827 |
| Range | $84,759 | $129,806 |
| Mean | $72,692 | $82,539 |
| Median | $73,540 | $79,366 |
| Interquartile 25% (IQ1) | $59,714 | $64,523 |
| Interquartile 75% (IQ3) | $84,854 | $93,010 |
| Interquartile Range (IQR) | $25,140 | $28,486 |
| Standard Deviation (Sample) | $17,679 | $23,089 |
| Standard Deviation (Population) | $17,550 | $22,924 |
Similar Demographics by Median Family Income
Demographics Similar to Hondurans by Median Family Income
In terms of median family income, the demographic groups most similar to Hondurans are Cuban ($84,981, a difference of 0.030%), Immigrants from Central America ($85,050, a difference of 0.050%), Choctaw ($84,835, a difference of 0.20%), Haitian ($85,218, a difference of 0.25%), and Immigrants from Bahamas ($84,732, a difference of 0.32%).
| Demographics | Rating | Rank | Median Family Income |
| Mexicans | 0.0 /100 | #304 | Tragic $85,618 |
| Paiute | 0.0 /100 | #305 | Tragic $85,414 |
| Immigrants | Dominica | 0.0 /100 | #306 | Tragic $85,411 |
| Chickasaw | 0.0 /100 | #307 | Tragic $85,356 |
| U.S. Virgin Islanders | 0.0 /100 | #308 | Tragic $85,294 |
| Haitians | 0.0 /100 | #309 | Tragic $85,218 |
| Immigrants | Central America | 0.0 /100 | #310 | Tragic $85,050 |
| Hondurans | 0.0 /100 | #311 | Tragic $85,004 |
| Cubans | 0.0 /100 | #312 | Tragic $84,981 |
| Choctaw | 0.0 /100 | #313 | Tragic $84,835 |
| Immigrants | Bahamas | 0.0 /100 | #314 | Tragic $84,732 |
| Apache | 0.0 /100 | #315 | Tragic $84,451 |
| Immigrants | Haiti | 0.0 /100 | #316 | Tragic $84,018 |
| Yakama | 0.0 /100 | #317 | Tragic $83,932 |
| Immigrants | Mexico | 0.0 /100 | #318 | Tragic $83,639 |
Demographics Similar to Immigrants from Laos by Median Family Income
In terms of median family income, the demographic groups most similar to Immigrants from Laos are Nicaraguan ($92,231, a difference of 0.010%), American ($92,096, a difference of 0.16%), Immigrants from Barbados ($92,419, a difference of 0.20%), Immigrants from Guyana ($92,513, a difference of 0.30%), and Immigrants from El Salvador ($92,545, a difference of 0.33%).
| Demographics | Rating | Rank | Median Family Income |
| French American Indians | 0.7 /100 | #248 | Tragic $92,872 |
| Immigrants | Ecuador | 0.7 /100 | #249 | Tragic $92,837 |
| West Indians | 0.6 /100 | #250 | Tragic $92,765 |
| Immigrants | Somalia | 0.6 /100 | #251 | Tragic $92,609 |
| Immigrants | El Salvador | 0.6 /100 | #252 | Tragic $92,545 |
| Immigrants | Guyana | 0.6 /100 | #253 | Tragic $92,513 |
| Immigrants | Barbados | 0.5 /100 | #254 | Tragic $92,419 |
| Immigrants | Laos | 0.5 /100 | #255 | Tragic $92,239 |
| Nicaraguans | 0.5 /100 | #256 | Tragic $92,231 |
| Americans | 0.4 /100 | #257 | Tragic $92,096 |
| Osage | 0.4 /100 | #258 | Tragic $91,926 |
| Cape Verdeans | 0.4 /100 | #259 | Tragic $91,848 |
| Pennsylvania Germans | 0.4 /100 | #260 | Tragic $91,763 |
| Inupiat | 0.4 /100 | #261 | Tragic $91,730 |
| Liberians | 0.4 /100 | #262 | Tragic $91,722 |