Yaqui vs Ecuadorian Single Mother Households
COMPARE
Yaqui
Ecuadorian
Single Mother Households
Single Mother Households Comparison
Yaqui
Ecuadorians
7.4%
SINGLE MOTHER HOUSEHOLDS
0.1/ 100
METRIC RATING
264th/ 347
METRIC RANK
7.2%
SINGLE MOTHER HOUSEHOLDS
0.6/ 100
METRIC RATING
243rd/ 347
METRIC RANK
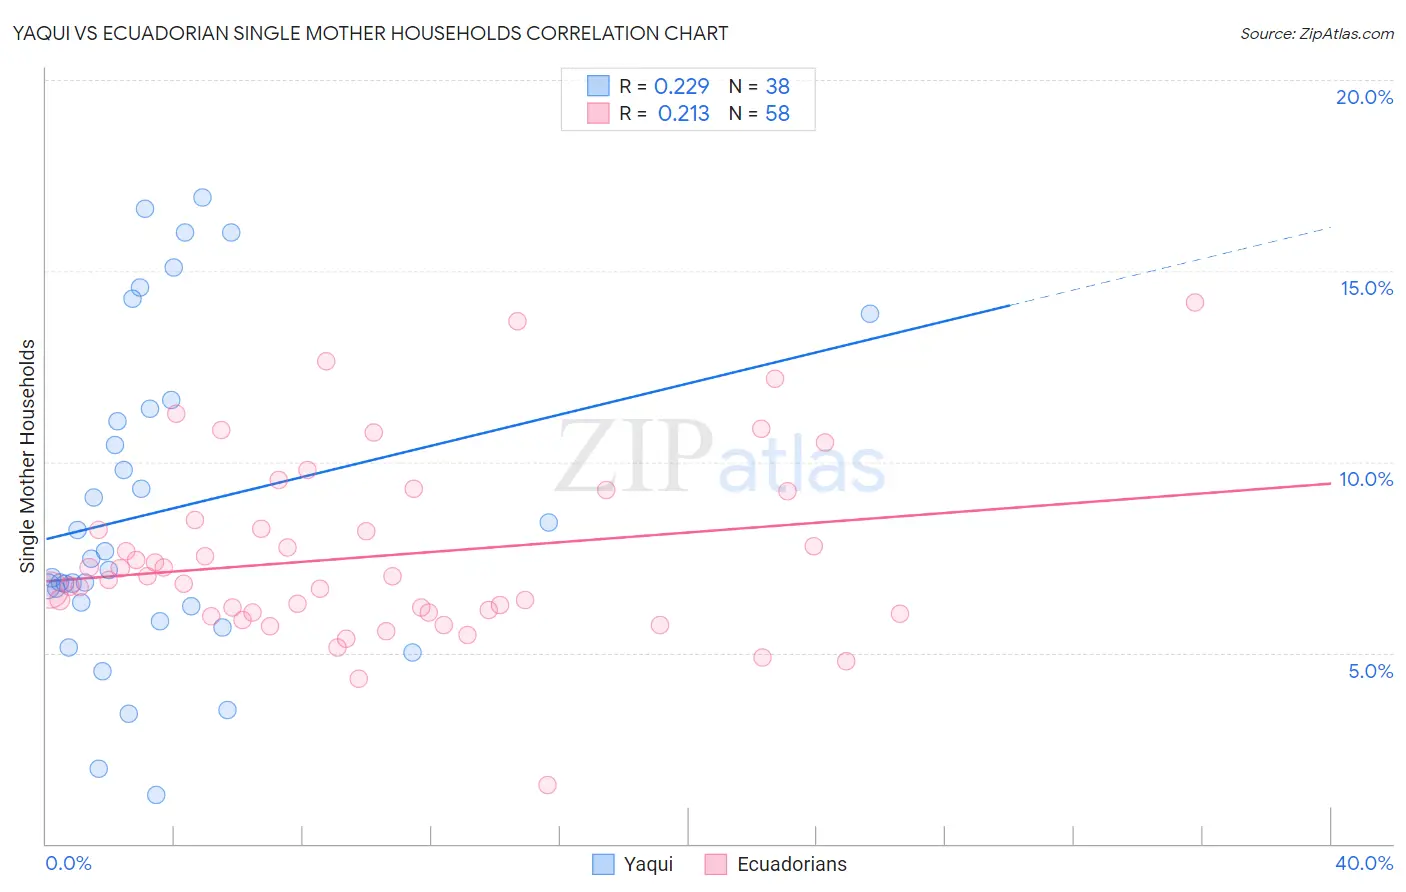
Yaqui vs Ecuadorian Single Mother Households Correlation Chart
The statistical analysis conducted on geographies consisting of 107,663,122 people shows a weak positive correlation between the proportion of Yaqui and percentage of single mother households in the United States with a correlation coefficient (R) of 0.229 and weighted average of 7.4%. Similarly, the statistical analysis conducted on geographies consisting of 317,272,224 people shows a weak positive correlation between the proportion of Ecuadorians and percentage of single mother households in the United States with a correlation coefficient (R) of 0.213 and weighted average of 7.2%, a difference of 3.3%.
Single Mother Households Correlation Summary
| Measurement | Yaqui | Ecuadorian |
| Minimum | 1.3% | 1.5% |
| Maximum | 16.9% | 14.2% |
| Range | 15.6% | 12.7% |
| Mean | 8.7% | 7.5% |
| Median | 7.3% | 7.0% |
| Interquartile 25% (IQ1) | 6.2% | 6.0% |
| Interquartile 75% (IQ3) | 11.4% | 8.5% |
| Interquartile Range (IQR) | 5.2% | 2.5% |
| Standard Deviation (Sample) | 4.2% | 2.4% |
| Standard Deviation (Population) | 4.2% | 2.4% |
Similar Demographics by Single Mother Households
Demographics Similar to Yaqui by Single Mother Households
In terms of single mother households, the demographic groups most similar to Yaqui are Immigrants from Nicaragua (7.4%, a difference of 0.080%), Crow (7.4%, a difference of 0.18%), Immigrants from Somalia (7.4%, a difference of 0.23%), Nepalese (7.5%, a difference of 0.27%), and Japanese (7.4%, a difference of 0.43%).
| Demographics | Rating | Rank | Single Mother Households |
| Alaska Natives | 0.2 /100 | #257 | Tragic 7.4% |
| Pueblo | 0.2 /100 | #258 | Tragic 7.4% |
| Immigrants | Yemen | 0.2 /100 | #259 | Tragic 7.4% |
| Immigrants | Zaire | 0.2 /100 | #260 | Tragic 7.4% |
| Japanese | 0.2 /100 | #261 | Tragic 7.4% |
| Immigrants | Somalia | 0.2 /100 | #262 | Tragic 7.4% |
| Immigrants | Nicaragua | 0.2 /100 | #263 | Tragic 7.4% |
| Yaqui | 0.1 /100 | #264 | Tragic 7.4% |
| Crow | 0.1 /100 | #265 | Tragic 7.4% |
| Nepalese | 0.1 /100 | #266 | Tragic 7.5% |
| Blackfeet | 0.1 /100 | #267 | Tragic 7.5% |
| Indonesians | 0.1 /100 | #268 | Tragic 7.5% |
| Somalis | 0.1 /100 | #269 | Tragic 7.5% |
| Immigrants | Cuba | 0.1 /100 | #270 | Tragic 7.5% |
| Salvadorans | 0.1 /100 | #271 | Tragic 7.5% |
Demographics Similar to Ecuadorians by Single Mother Households
In terms of single mother households, the demographic groups most similar to Ecuadorians are Fijian (7.2%, a difference of 0.050%), Cuban (7.2%, a difference of 0.070%), Immigrants from Portugal (7.2%, a difference of 0.13%), Immigrants from Cambodia (7.2%, a difference of 0.41%), and Immigrants from Panama (7.2%, a difference of 0.48%).
| Demographics | Rating | Rank | Single Mother Households |
| Ute | 1.0 /100 | #236 | Tragic 7.1% |
| Arapaho | 1.0 /100 | #237 | Tragic 7.1% |
| Panamanians | 0.9 /100 | #238 | Tragic 7.1% |
| Kiowa | 0.8 /100 | #239 | Tragic 7.1% |
| Immigrants | Panama | 0.7 /100 | #240 | Tragic 7.2% |
| Immigrants | Portugal | 0.6 /100 | #241 | Tragic 7.2% |
| Fijians | 0.6 /100 | #242 | Tragic 7.2% |
| Ecuadorians | 0.6 /100 | #243 | Tragic 7.2% |
| Cubans | 0.6 /100 | #244 | Tragic 7.2% |
| Immigrants | Cambodia | 0.5 /100 | #245 | Tragic 7.2% |
| Nicaraguans | 0.5 /100 | #246 | Tragic 7.2% |
| Dutch West Indians | 0.4 /100 | #247 | Tragic 7.3% |
| Spanish American Indians | 0.4 /100 | #248 | Tragic 7.3% |
| Bermudans | 0.4 /100 | #249 | Tragic 7.3% |
| Immigrants | Africa | 0.4 /100 | #250 | Tragic 7.3% |