Yaqui vs Russian Householder Income Over 65 years
COMPARE
Yaqui
Russian
Householder Income Over 65 years
Householder Income Over 65 years Comparison
Yaqui
Russians
$56,417
HOUSEHOLDER INCOME OVER 65 YEARS
0.8/ 100
METRIC RATING
242nd/ 347
METRIC RANK
$67,626
HOUSEHOLDER INCOME OVER 65 YEARS
99.9/ 100
METRIC RATING
39th/ 347
METRIC RANK
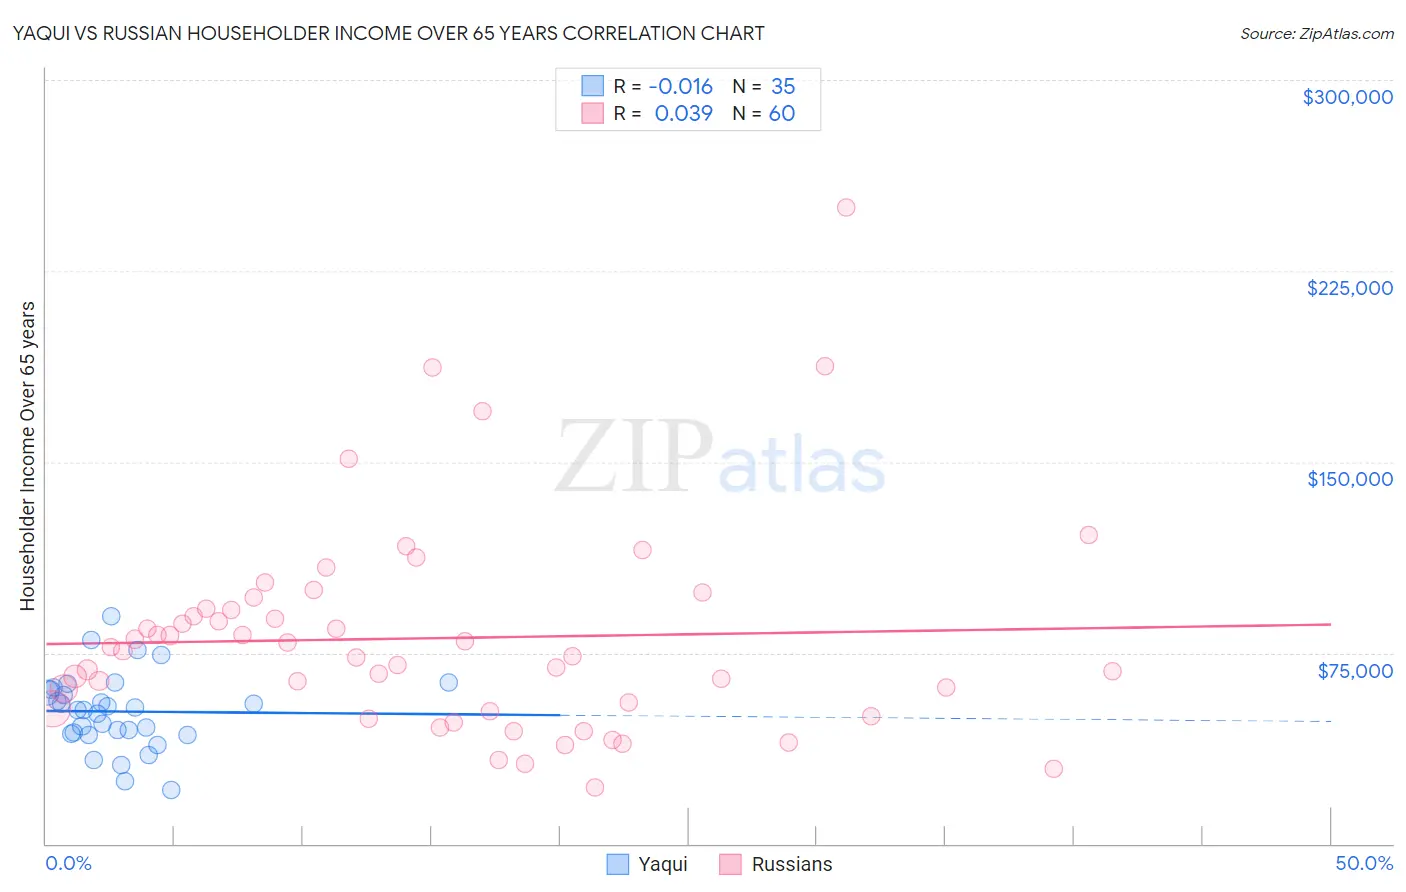
Yaqui vs Russian Householder Income Over 65 years Correlation Chart
The statistical analysis conducted on geographies consisting of 107,596,912 people shows no correlation between the proportion of Yaqui and household income with householder over the age of 65 in the United States with a correlation coefficient (R) of -0.016 and weighted average of $56,417. Similarly, the statistical analysis conducted on geographies consisting of 509,158,654 people shows no correlation between the proportion of Russians and household income with householder over the age of 65 in the United States with a correlation coefficient (R) of 0.039 and weighted average of $67,626, a difference of 19.9%.
Householder Income Over 65 years Correlation Summary
| Measurement | Yaqui | Russian |
| Minimum | $21,164 | $22,236 |
| Maximum | $89,308 | $250,001 |
| Range | $68,144 | $227,765 |
| Mean | $51,933 | $80,788 |
| Median | $52,760 | $74,810 |
| Interquartile 25% (IQ1) | $42,965 | $52,373 |
| Interquartile 75% (IQ3) | $60,509 | $92,060 |
| Interquartile Range (IQR) | $17,544 | $39,687 |
| Standard Deviation (Sample) | $14,813 | $41,509 |
| Standard Deviation (Population) | $14,600 | $41,162 |
Similar Demographics by Householder Income Over 65 years
Demographics Similar to Yaqui by Householder Income Over 65 years
In terms of householder income over 65 years, the demographic groups most similar to Yaqui are Guyanese ($56,351, a difference of 0.12%), Immigrants from Guyana ($56,495, a difference of 0.14%), Hmong ($56,339, a difference of 0.14%), Immigrants from Uzbekistan ($56,331, a difference of 0.15%), and Central American ($56,321, a difference of 0.17%).
| Demographics | Rating | Rank | Householder Income Over 65 years |
| Spanish Americans | 1.6 /100 | #235 | Tragic $57,021 |
| Immigrants | Uruguay | 1.5 /100 | #236 | Tragic $56,975 |
| Immigrants | Panama | 1.5 /100 | #237 | Tragic $56,944 |
| Fijians | 1.2 /100 | #238 | Tragic $56,768 |
| Immigrants | Laos | 1.2 /100 | #239 | Tragic $56,722 |
| Sub-Saharan Africans | 1.0 /100 | #240 | Tragic $56,615 |
| Immigrants | Guyana | 0.9 /100 | #241 | Tragic $56,495 |
| Yaqui | 0.8 /100 | #242 | Tragic $56,417 |
| Guyanese | 0.8 /100 | #243 | Tragic $56,351 |
| Hmong | 0.8 /100 | #244 | Tragic $56,339 |
| Immigrants | Uzbekistan | 0.8 /100 | #245 | Tragic $56,331 |
| Central Americans | 0.8 /100 | #246 | Tragic $56,321 |
| Yakama | 0.7 /100 | #247 | Tragic $56,234 |
| Vietnamese | 0.6 /100 | #248 | Tragic $56,143 |
| Mexican American Indians | 0.6 /100 | #249 | Tragic $56,089 |
Demographics Similar to Russians by Householder Income Over 65 years
In terms of householder income over 65 years, the demographic groups most similar to Russians are Immigrants from Asia ($67,594, a difference of 0.050%), Korean ($67,472, a difference of 0.23%), Estonian ($67,926, a difference of 0.44%), New Zealander ($67,333, a difference of 0.44%), and Latvian ($67,326, a difference of 0.45%).
| Demographics | Rating | Rank | Householder Income Over 65 years |
| Asians | 100.0 /100 | #32 | Exceptional $68,822 |
| Immigrants | Denmark | 100.0 /100 | #33 | Exceptional $68,801 |
| Immigrants | Ireland | 100.0 /100 | #34 | Exceptional $68,495 |
| Tongans | 100.0 /100 | #35 | Exceptional $68,235 |
| Immigrants | Austria | 99.9 /100 | #36 | Exceptional $68,208 |
| Turks | 99.9 /100 | #37 | Exceptional $68,037 |
| Estonians | 99.9 /100 | #38 | Exceptional $67,926 |
| Russians | 99.9 /100 | #39 | Exceptional $67,626 |
| Immigrants | Asia | 99.9 /100 | #40 | Exceptional $67,594 |
| Koreans | 99.9 /100 | #41 | Exceptional $67,472 |
| New Zealanders | 99.9 /100 | #42 | Exceptional $67,333 |
| Latvians | 99.9 /100 | #43 | Exceptional $67,326 |
| Immigrants | South Africa | 99.9 /100 | #44 | Exceptional $67,234 |
| Immigrants | Afghanistan | 99.8 /100 | #45 | Exceptional $67,007 |
| Cambodians | 99.8 /100 | #46 | Exceptional $66,892 |