Yaqui vs Japanese Householder Income Over 65 years
COMPARE
Yaqui
Japanese
Householder Income Over 65 years
Householder Income Over 65 years Comparison
Yaqui
Japanese
$56,417
HOUSEHOLDER INCOME OVER 65 YEARS
0.8/ 100
METRIC RATING
242nd/ 347
METRIC RANK
$57,919
HOUSEHOLDER INCOME OVER 65 YEARS
3.9/ 100
METRIC RATING
227th/ 347
METRIC RANK
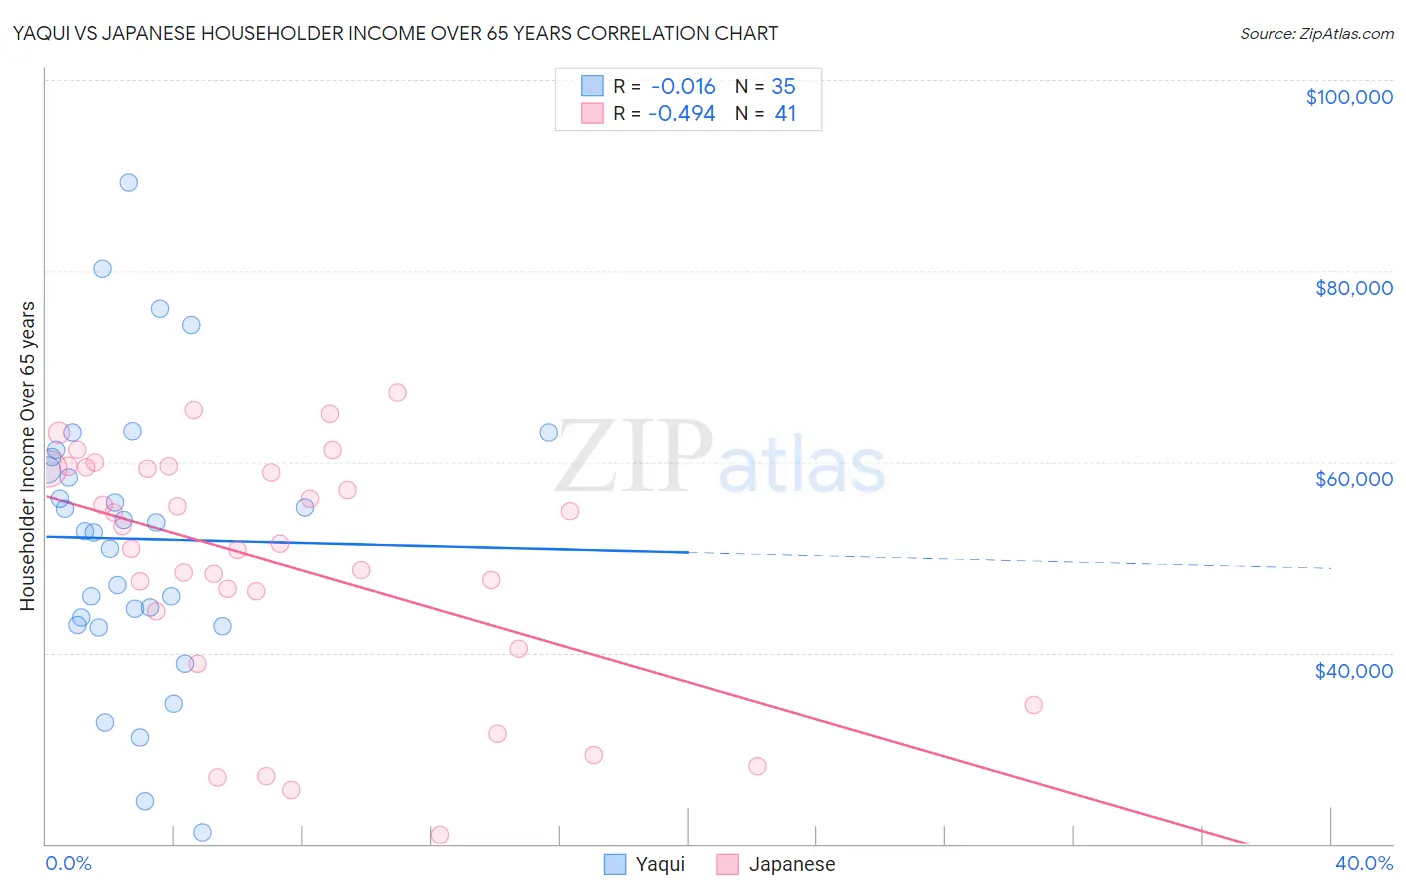
Yaqui vs Japanese Householder Income Over 65 years Correlation Chart
The statistical analysis conducted on geographies consisting of 107,596,912 people shows no correlation between the proportion of Yaqui and household income with householder over the age of 65 in the United States with a correlation coefficient (R) of -0.016 and weighted average of $56,417. Similarly, the statistical analysis conducted on geographies consisting of 248,642,327 people shows a moderate negative correlation between the proportion of Japanese and household income with householder over the age of 65 in the United States with a correlation coefficient (R) of -0.494 and weighted average of $57,919, a difference of 2.7%.
Householder Income Over 65 years Correlation Summary
| Measurement | Yaqui | Japanese |
| Minimum | $21,164 | $20,958 |
| Maximum | $89,308 | $67,267 |
| Range | $68,144 | $46,309 |
| Mean | $51,933 | $49,288 |
| Median | $52,760 | $51,375 |
| Interquartile 25% (IQ1) | $42,965 | $42,447 |
| Interquartile 75% (IQ3) | $60,509 | $59,385 |
| Interquartile Range (IQR) | $17,544 | $16,939 |
| Standard Deviation (Sample) | $14,813 | $12,523 |
| Standard Deviation (Population) | $14,600 | $12,369 |
Demographics Similar to Yaqui and Japanese by Householder Income Over 65 years
In terms of householder income over 65 years, the demographic groups most similar to Yaqui are Guyanese ($56,351, a difference of 0.12%), Immigrants from Guyana ($56,495, a difference of 0.14%), Hmong ($56,339, a difference of 0.14%), Subsaharan African ($56,615, a difference of 0.35%), and Immigrants from Laos ($56,722, a difference of 0.54%). Similarly, the demographic groups most similar to Japanese are French Canadian ($57,975, a difference of 0.10%), Immigrants from Albania ($57,828, a difference of 0.16%), Venezuelan ($58,026, a difference of 0.18%), Bermudan ($58,171, a difference of 0.43%), and Immigrants from Colombia ($57,658, a difference of 0.45%).
| Demographics | Rating | Rank | Householder Income Over 65 years |
| Bermudans | 5.1 /100 | #224 | Tragic $58,171 |
| Venezuelans | 4.4 /100 | #225 | Tragic $58,026 |
| French Canadians | 4.2 /100 | #226 | Tragic $57,975 |
| Japanese | 3.9 /100 | #227 | Tragic $57,919 |
| Immigrants | Albania | 3.6 /100 | #228 | Tragic $57,828 |
| Immigrants | Colombia | 3.0 /100 | #229 | Tragic $57,658 |
| Immigrants | Cambodia | 2.8 /100 | #230 | Tragic $57,580 |
| Immigrants | Nonimmigrants | 2.4 /100 | #231 | Tragic $57,426 |
| Immigrants | Venezuela | 2.3 /100 | #232 | Tragic $57,371 |
| Immigrants | Western Africa | 1.7 /100 | #233 | Tragic $57,119 |
| Immigrants | Burma/Myanmar | 1.7 /100 | #234 | Tragic $57,114 |
| Spanish Americans | 1.6 /100 | #235 | Tragic $57,021 |
| Immigrants | Uruguay | 1.5 /100 | #236 | Tragic $56,975 |
| Immigrants | Panama | 1.5 /100 | #237 | Tragic $56,944 |
| Fijians | 1.2 /100 | #238 | Tragic $56,768 |
| Immigrants | Laos | 1.2 /100 | #239 | Tragic $56,722 |
| Sub-Saharan Africans | 1.0 /100 | #240 | Tragic $56,615 |
| Immigrants | Guyana | 0.9 /100 | #241 | Tragic $56,495 |
| Yaqui | 0.8 /100 | #242 | Tragic $56,417 |
| Guyanese | 0.8 /100 | #243 | Tragic $56,351 |
| Hmong | 0.8 /100 | #244 | Tragic $56,339 |