Yaqui vs Thai Householder Income Over 65 years
COMPARE
Yaqui
Thai
Householder Income Over 65 years
Householder Income Over 65 years Comparison
Yaqui
Thais
$56,417
HOUSEHOLDER INCOME OVER 65 YEARS
0.8/ 100
METRIC RATING
242nd/ 347
METRIC RANK
$72,099
HOUSEHOLDER INCOME OVER 65 YEARS
100.0/ 100
METRIC RATING
11th/ 347
METRIC RANK
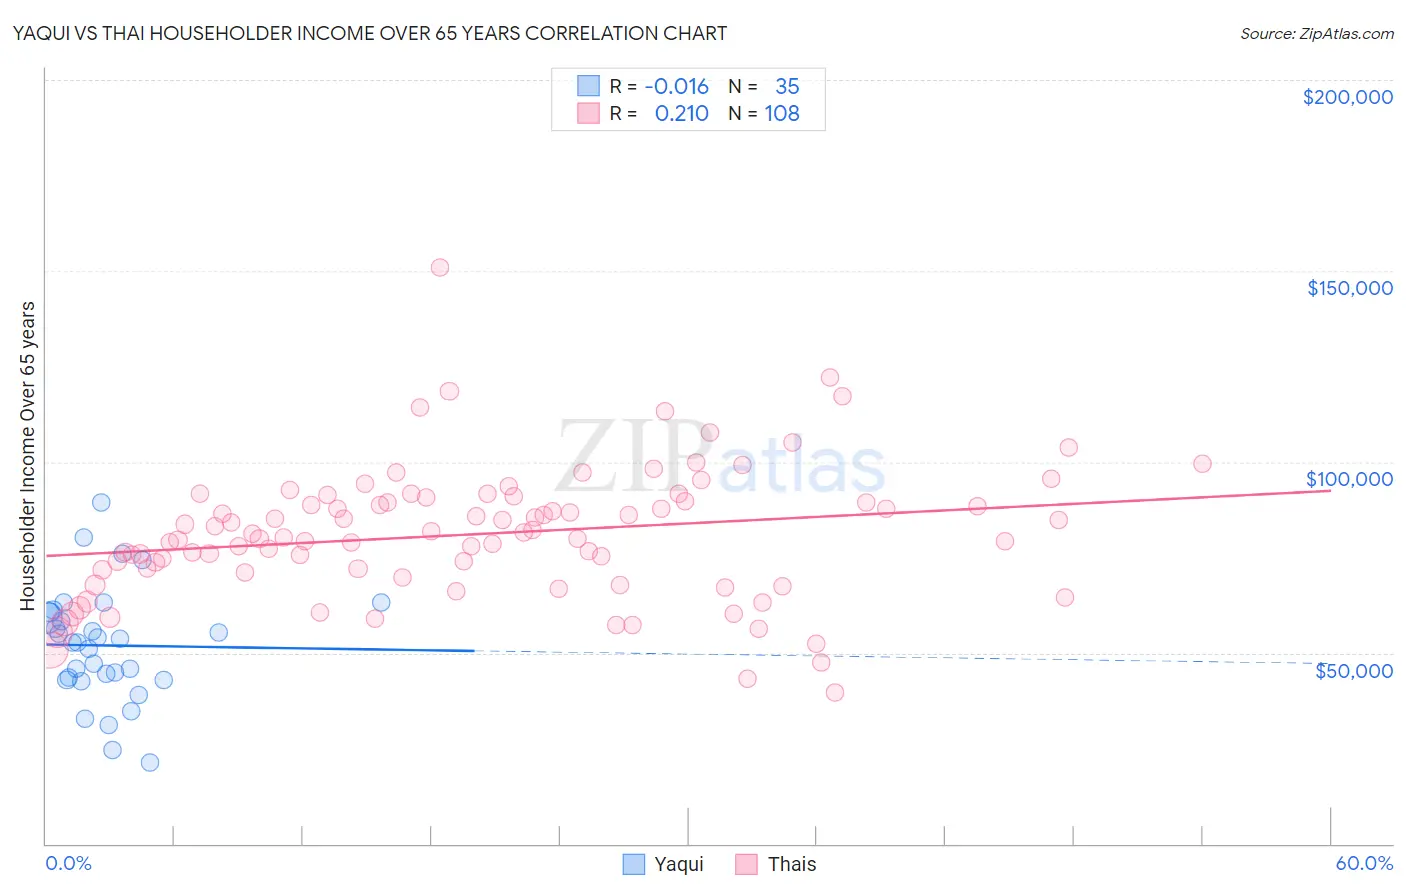
Yaqui vs Thai Householder Income Over 65 years Correlation Chart
The statistical analysis conducted on geographies consisting of 107,596,912 people shows no correlation between the proportion of Yaqui and household income with householder over the age of 65 in the United States with a correlation coefficient (R) of -0.016 and weighted average of $56,417. Similarly, the statistical analysis conducted on geographies consisting of 473,553,287 people shows a weak positive correlation between the proportion of Thais and household income with householder over the age of 65 in the United States with a correlation coefficient (R) of 0.210 and weighted average of $72,099, a difference of 27.8%.
Householder Income Over 65 years Correlation Summary
| Measurement | Yaqui | Thai |
| Minimum | $21,164 | $39,750 |
| Maximum | $89,308 | $150,903 |
| Range | $68,144 | $111,153 |
| Mean | $51,933 | $81,057 |
| Median | $52,760 | $80,676 |
| Interquartile 25% (IQ1) | $42,965 | $71,396 |
| Interquartile 75% (IQ3) | $60,509 | $90,161 |
| Interquartile Range (IQR) | $17,544 | $18,766 |
| Standard Deviation (Sample) | $14,813 | $17,305 |
| Standard Deviation (Population) | $14,600 | $17,224 |
Similar Demographics by Householder Income Over 65 years
Demographics Similar to Yaqui by Householder Income Over 65 years
In terms of householder income over 65 years, the demographic groups most similar to Yaqui are Guyanese ($56,351, a difference of 0.12%), Immigrants from Guyana ($56,495, a difference of 0.14%), Hmong ($56,339, a difference of 0.14%), Immigrants from Uzbekistan ($56,331, a difference of 0.15%), and Central American ($56,321, a difference of 0.17%).
| Demographics | Rating | Rank | Householder Income Over 65 years |
| Spanish Americans | 1.6 /100 | #235 | Tragic $57,021 |
| Immigrants | Uruguay | 1.5 /100 | #236 | Tragic $56,975 |
| Immigrants | Panama | 1.5 /100 | #237 | Tragic $56,944 |
| Fijians | 1.2 /100 | #238 | Tragic $56,768 |
| Immigrants | Laos | 1.2 /100 | #239 | Tragic $56,722 |
| Sub-Saharan Africans | 1.0 /100 | #240 | Tragic $56,615 |
| Immigrants | Guyana | 0.9 /100 | #241 | Tragic $56,495 |
| Yaqui | 0.8 /100 | #242 | Tragic $56,417 |
| Guyanese | 0.8 /100 | #243 | Tragic $56,351 |
| Hmong | 0.8 /100 | #244 | Tragic $56,339 |
| Immigrants | Uzbekistan | 0.8 /100 | #245 | Tragic $56,331 |
| Central Americans | 0.8 /100 | #246 | Tragic $56,321 |
| Yakama | 0.7 /100 | #247 | Tragic $56,234 |
| Vietnamese | 0.6 /100 | #248 | Tragic $56,143 |
| Mexican American Indians | 0.6 /100 | #249 | Tragic $56,089 |
Demographics Similar to Thais by Householder Income Over 65 years
In terms of householder income over 65 years, the demographic groups most similar to Thais are Bhutanese ($72,288, a difference of 0.26%), Cypriot ($71,714, a difference of 0.54%), Immigrants from Hong Kong ($71,567, a difference of 0.74%), Immigrants from India ($72,804, a difference of 0.98%), and Immigrants from Singapore ($72,963, a difference of 1.2%).
| Demographics | Rating | Rank | Householder Income Over 65 years |
| Filipinos | 100.0 /100 | #4 | Exceptional $76,686 |
| Immigrants | Iran | 100.0 /100 | #5 | Exceptional $75,081 |
| Bolivians | 100.0 /100 | #6 | Exceptional $74,245 |
| Immigrants | Bolivia | 100.0 /100 | #7 | Exceptional $73,434 |
| Immigrants | Singapore | 100.0 /100 | #8 | Exceptional $72,963 |
| Immigrants | India | 100.0 /100 | #9 | Exceptional $72,804 |
| Bhutanese | 100.0 /100 | #10 | Exceptional $72,288 |
| Thais | 100.0 /100 | #11 | Exceptional $72,099 |
| Cypriots | 100.0 /100 | #12 | Exceptional $71,714 |
| Immigrants | Hong Kong | 100.0 /100 | #13 | Exceptional $71,567 |
| Burmese | 100.0 /100 | #14 | Exceptional $71,139 |
| Native Hawaiians | 100.0 /100 | #15 | Exceptional $71,021 |
| Okinawans | 100.0 /100 | #16 | Exceptional $70,846 |
| Immigrants | Korea | 100.0 /100 | #17 | Exceptional $70,696 |
| Eastern Europeans | 100.0 /100 | #18 | Exceptional $70,470 |