Crow vs Yugoslavian Householder Income Under 25 years
COMPARE
Crow
Yugoslavian
Householder Income Under 25 years
Householder Income Under 25 years Comparison
Crow
Yugoslavians
$47,012
HOUSEHOLDER INCOME UNDER 25 YEARS
0.0/ 100
METRIC RATING
315th/ 347
METRIC RANK
$51,028
HOUSEHOLDER INCOME UNDER 25 YEARS
5.5/ 100
METRIC RATING
226th/ 347
METRIC RANK
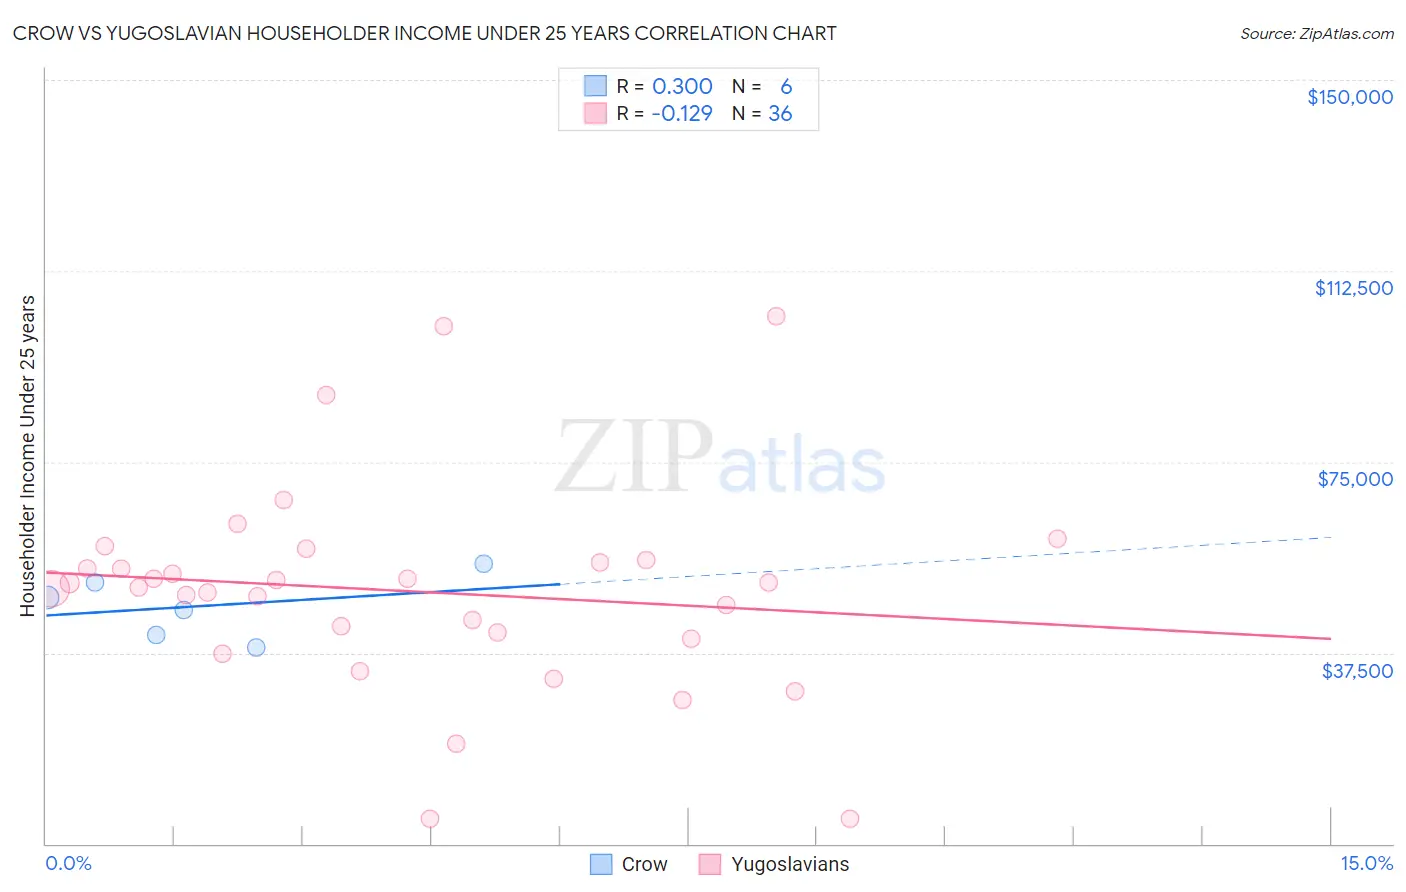
Crow vs Yugoslavian Householder Income Under 25 years Correlation Chart
The statistical analysis conducted on geographies consisting of 57,021,260 people shows a mild positive correlation between the proportion of Crow and household income with householder under the age of 25 in the United States with a correlation coefficient (R) of 0.300 and weighted average of $47,012. Similarly, the statistical analysis conducted on geographies consisting of 250,106,142 people shows a poor negative correlation between the proportion of Yugoslavians and household income with householder under the age of 25 in the United States with a correlation coefficient (R) of -0.129 and weighted average of $51,028, a difference of 8.5%.
Householder Income Under 25 years Correlation Summary
| Measurement | Crow | Yugoslavian |
| Minimum | $38,660 | $4,881 |
| Maximum | $55,000 | $103,500 |
| Range | $16,340 | $98,619 |
| Mean | $46,718 | $49,574 |
| Median | $47,186 | $50,803 |
| Interquartile 25% (IQ1) | $41,057 | $40,912 |
| Interquartile 75% (IQ3) | $51,221 | $55,573 |
| Interquartile Range (IQR) | $10,164 | $14,662 |
| Standard Deviation (Sample) | $6,149 | $20,475 |
| Standard Deviation (Population) | $5,613 | $20,189 |
Similar Demographics by Householder Income Under 25 years
Demographics Similar to Crow by Householder Income Under 25 years
In terms of householder income under 25 years, the demographic groups most similar to Crow are Chippewa ($47,015, a difference of 0.010%), Sudanese ($46,982, a difference of 0.060%), Hopi ($46,978, a difference of 0.070%), Spanish American ($46,913, a difference of 0.21%), and Delaware ($47,159, a difference of 0.31%).
| Demographics | Rating | Rank | Householder Income Under 25 years |
| Comanche | 0.0 /100 | #308 | Tragic $47,518 |
| U.S. Virgin Islanders | 0.0 /100 | #309 | Tragic $47,448 |
| Iroquois | 0.0 /100 | #310 | Tragic $47,380 |
| Ottawa | 0.0 /100 | #311 | Tragic $47,366 |
| Bermudans | 0.0 /100 | #312 | Tragic $47,359 |
| Delaware | 0.0 /100 | #313 | Tragic $47,159 |
| Chippewa | 0.0 /100 | #314 | Tragic $47,015 |
| Crow | 0.0 /100 | #315 | Tragic $47,012 |
| Sudanese | 0.0 /100 | #316 | Tragic $46,982 |
| Hopi | 0.0 /100 | #317 | Tragic $46,978 |
| Spanish Americans | 0.0 /100 | #318 | Tragic $46,913 |
| Africans | 0.0 /100 | #319 | Tragic $46,838 |
| Immigrants | Sudan | 0.0 /100 | #320 | Tragic $46,791 |
| Potawatomi | 0.0 /100 | #321 | Tragic $46,462 |
| Sioux | 0.0 /100 | #322 | Tragic $46,417 |
Demographics Similar to Yugoslavians by Householder Income Under 25 years
In terms of householder income under 25 years, the demographic groups most similar to Yugoslavians are Immigrants from Central America ($51,022, a difference of 0.010%), Immigrants from Jamaica ($51,038, a difference of 0.020%), Immigrants from Norway ($50,984, a difference of 0.090%), Belizean ($51,094, a difference of 0.13%), and Serbian ($51,106, a difference of 0.15%).
| Demographics | Rating | Rank | Householder Income Under 25 years |
| Arabs | 8.5 /100 | #219 | Tragic $51,219 |
| Immigrants | Germany | 8.0 /100 | #220 | Tragic $51,190 |
| Immigrants | Eastern Africa | 7.4 /100 | #221 | Tragic $51,158 |
| Spaniards | 6.8 /100 | #222 | Tragic $51,117 |
| Serbians | 6.6 /100 | #223 | Tragic $51,106 |
| Belizeans | 6.4 /100 | #224 | Tragic $51,094 |
| Immigrants | Jamaica | 5.6 /100 | #225 | Tragic $51,038 |
| Yugoslavians | 5.5 /100 | #226 | Tragic $51,028 |
| Immigrants | Central America | 5.4 /100 | #227 | Tragic $51,022 |
| Immigrants | Norway | 5.0 /100 | #228 | Tragic $50,984 |
| Yuman | 4.4 /100 | #229 | Tragic $50,933 |
| Jamaicans | 4.4 /100 | #230 | Tragic $50,929 |
| Ugandans | 4.3 /100 | #231 | Tragic $50,923 |
| Slovenes | 4.0 /100 | #232 | Tragic $50,886 |
| Pennsylvania Germans | 3.7 /100 | #233 | Tragic $50,852 |