White/Caucasian vs Immigrants from Mexico Median Female Earnings
COMPARE
White/Caucasian
Immigrants from Mexico
Median Female Earnings
Median Female Earnings Comparison
Whites/Caucasians
Immigrants from Mexico
$37,531
MEDIAN FEMALE EARNINGS
1.1/ 100
METRIC RATING
254th/ 347
METRIC RANK
$33,236
MEDIAN FEMALE EARNINGS
0.0/ 100
METRIC RATING
339th/ 347
METRIC RANK
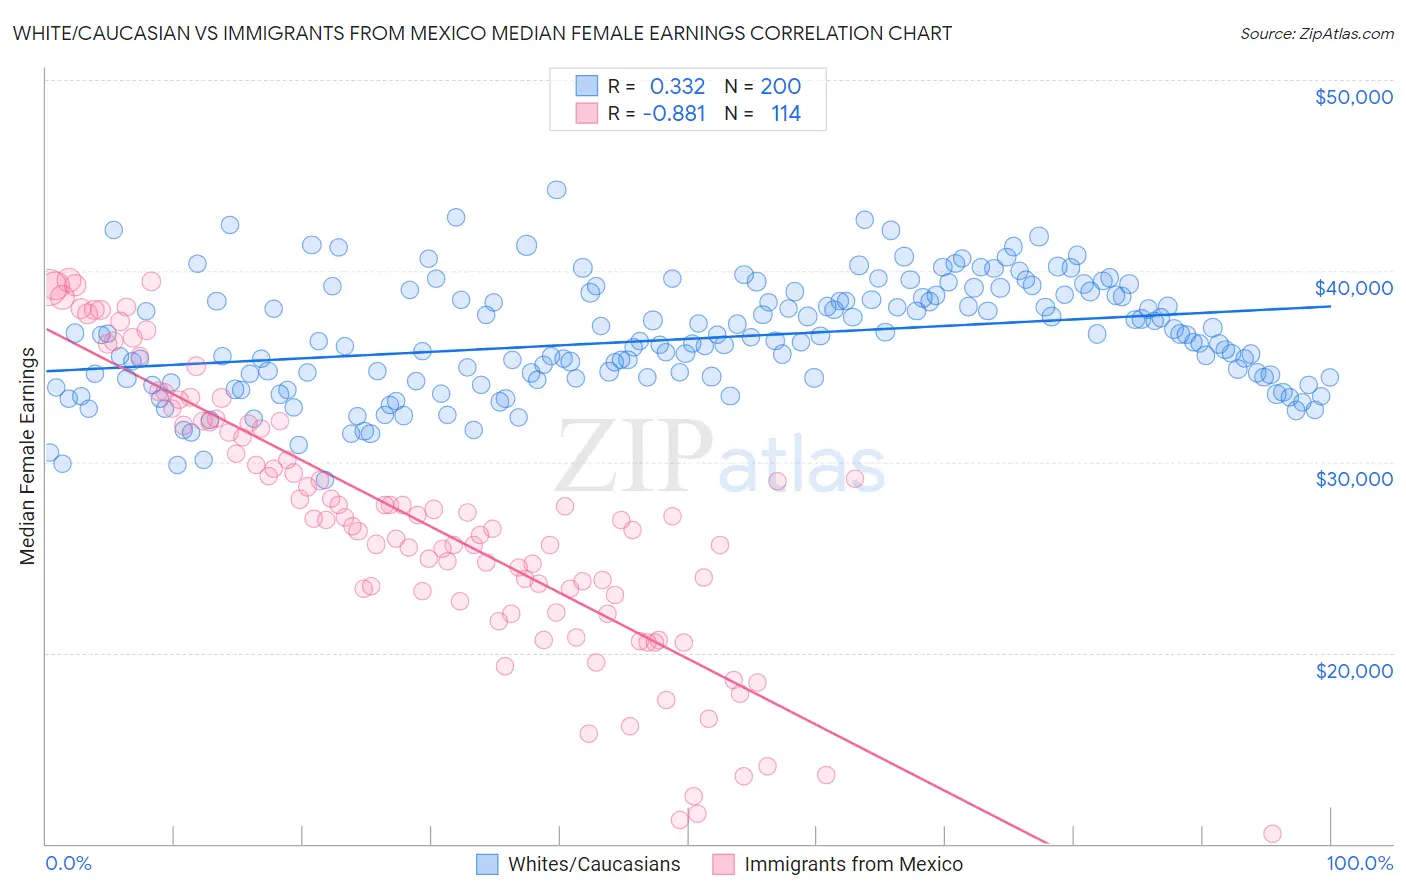
White/Caucasian vs Immigrants from Mexico Median Female Earnings Correlation Chart
The statistical analysis conducted on geographies consisting of 581,839,033 people shows a mild positive correlation between the proportion of Whites/Caucasians and median female earnings in the United States with a correlation coefficient (R) of 0.332 and weighted average of $37,531. Similarly, the statistical analysis conducted on geographies consisting of 512,787,138 people shows a very strong negative correlation between the proportion of Immigrants from Mexico and median female earnings in the United States with a correlation coefficient (R) of -0.881 and weighted average of $33,236, a difference of 12.9%.
Median Female Earnings Correlation Summary
| Measurement | White/Caucasian | Immigrants from Mexico |
| Minimum | $29,061 | $10,532 |
| Maximum | $44,249 | $39,508 |
| Range | $15,187 | $28,976 |
| Mean | $36,445 | $26,933 |
| Median | $36,298 | $26,949 |
| Interquartile 25% (IQ1) | $34,375 | $22,999 |
| Interquartile 75% (IQ3) | $38,681 | $32,002 |
| Interquartile Range (IQR) | $4,306 | $9,003 |
| Standard Deviation (Sample) | $2,956 | $6,963 |
| Standard Deviation (Population) | $2,949 | $6,932 |
Similar Demographics by Median Female Earnings
Demographics Similar to Whites/Caucasians by Median Female Earnings
In terms of median female earnings, the demographic groups most similar to Whites/Caucasians are Colville ($37,514, a difference of 0.040%), Samoan ($37,498, a difference of 0.090%), Hawaiian ($37,497, a difference of 0.090%), Belizean ($37,429, a difference of 0.27%), and Scotch-Irish ($37,383, a difference of 0.39%).
| Demographics | Rating | Rank | Median Female Earnings |
| Immigrants | Somalia | 2.4 /100 | #247 | Tragic $37,914 |
| Alaskan Athabascans | 2.3 /100 | #248 | Tragic $37,905 |
| Swiss | 2.3 /100 | #249 | Tragic $37,904 |
| Immigrants | Iraq | 2.2 /100 | #250 | Tragic $37,864 |
| Welsh | 2.1 /100 | #251 | Tragic $37,856 |
| Immigrants | Dominica | 2.0 /100 | #252 | Tragic $37,825 |
| Danes | 1.6 /100 | #253 | Tragic $37,730 |
| Whites/Caucasians | 1.1 /100 | #254 | Tragic $37,531 |
| Colville | 1.1 /100 | #255 | Tragic $37,514 |
| Samoans | 1.0 /100 | #256 | Tragic $37,498 |
| Hawaiians | 1.0 /100 | #257 | Tragic $37,497 |
| Belizeans | 0.9 /100 | #258 | Tragic $37,429 |
| Scotch-Irish | 0.8 /100 | #259 | Tragic $37,383 |
| Dutch | 0.7 /100 | #260 | Tragic $37,339 |
| Malaysians | 0.7 /100 | #261 | Tragic $37,298 |
Demographics Similar to Immigrants from Mexico by Median Female Earnings
In terms of median female earnings, the demographic groups most similar to Immigrants from Mexico are Tohono O'odham ($33,205, a difference of 0.090%), Immigrants from Cuba ($33,291, a difference of 0.17%), Yakama ($33,354, a difference of 0.36%), Ottawa ($33,378, a difference of 0.43%), and Navajo ($33,046, a difference of 0.57%).
| Demographics | Rating | Rank | Median Female Earnings |
| Choctaw | 0.0 /100 | #332 | Tragic $33,775 |
| Mexicans | 0.0 /100 | #333 | Tragic $33,664 |
| Spanish American Indians | 0.0 /100 | #334 | Tragic $33,625 |
| Creek | 0.0 /100 | #335 | Tragic $33,437 |
| Ottawa | 0.0 /100 | #336 | Tragic $33,378 |
| Yakama | 0.0 /100 | #337 | Tragic $33,354 |
| Immigrants | Cuba | 0.0 /100 | #338 | Tragic $33,291 |
| Immigrants | Mexico | 0.0 /100 | #339 | Tragic $33,236 |
| Tohono O'odham | 0.0 /100 | #340 | Tragic $33,205 |
| Navajo | 0.0 /100 | #341 | Tragic $33,046 |
| Yup'ik | 0.0 /100 | #342 | Tragic $32,730 |
| Pueblo | 0.0 /100 | #343 | Tragic $32,564 |
| Lumbee | 0.0 /100 | #344 | Tragic $32,500 |
| Puerto Ricans | 0.0 /100 | #345 | Tragic $31,560 |
| Arapaho | 0.0 /100 | #346 | Tragic $31,489 |