White/Caucasian vs Immigrants from South Africa Median Female Earnings
COMPARE
White/Caucasian
Immigrants from South Africa
Median Female Earnings
Median Female Earnings Comparison
Whites/Caucasians
Immigrants from South Africa
$37,531
MEDIAN FEMALE EARNINGS
1.1/ 100
METRIC RATING
254th/ 347
METRIC RANK
$42,508
MEDIAN FEMALE EARNINGS
99.7/ 100
METRIC RATING
74th/ 347
METRIC RANK
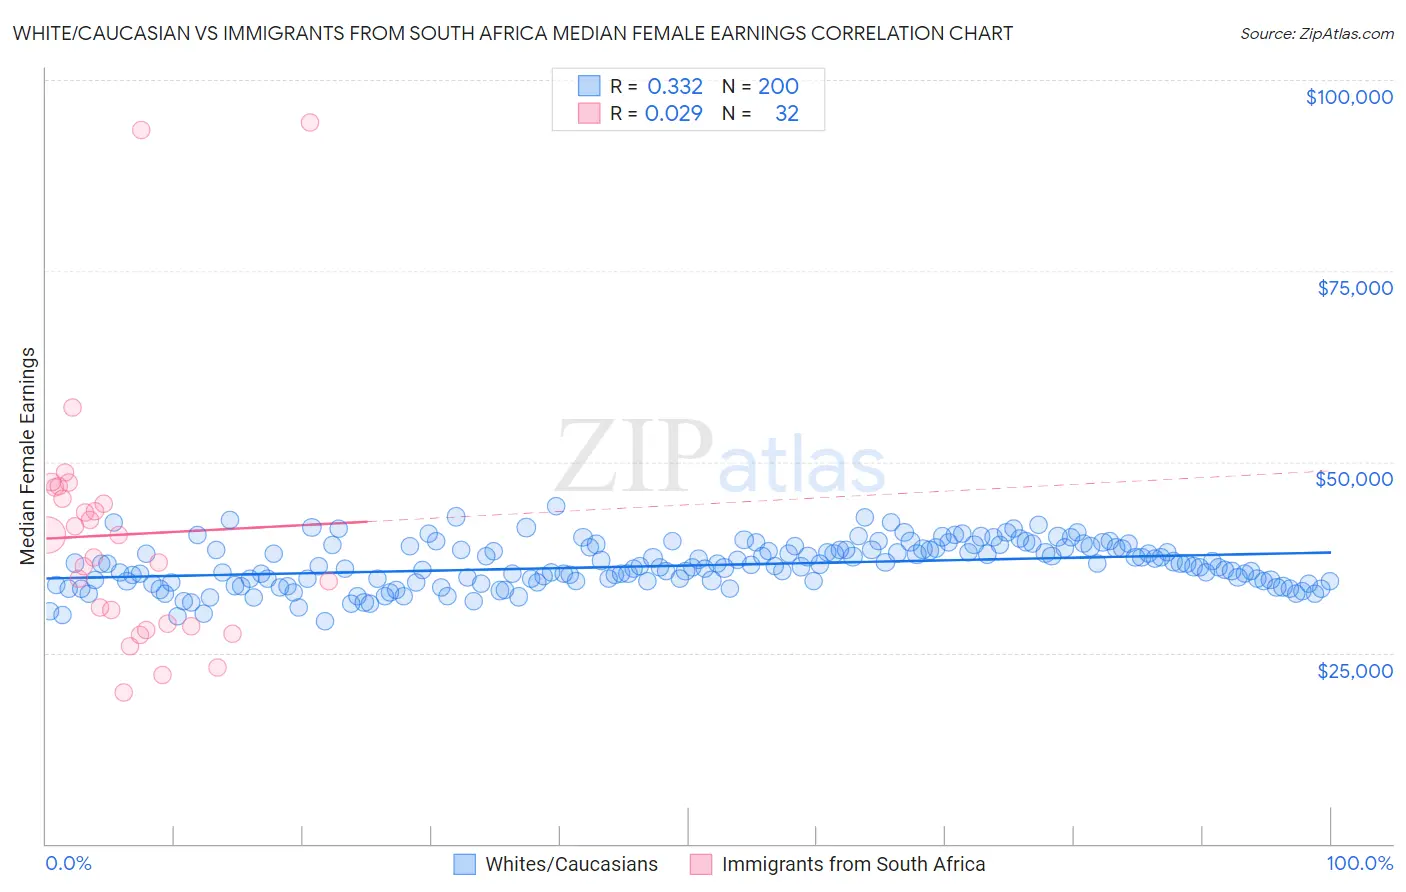
White/Caucasian vs Immigrants from South Africa Median Female Earnings Correlation Chart
The statistical analysis conducted on geographies consisting of 581,839,033 people shows a mild positive correlation between the proportion of Whites/Caucasians and median female earnings in the United States with a correlation coefficient (R) of 0.332 and weighted average of $37,531. Similarly, the statistical analysis conducted on geographies consisting of 233,273,838 people shows no correlation between the proportion of Immigrants from South Africa and median female earnings in the United States with a correlation coefficient (R) of 0.029 and weighted average of $42,508, a difference of 13.3%.
Median Female Earnings Correlation Summary
| Measurement | White/Caucasian | Immigrants from South Africa |
| Minimum | $29,061 | $19,821 |
| Maximum | $44,249 | $94,510 |
| Range | $15,187 | $74,689 |
| Mean | $36,445 | $40,489 |
| Median | $36,298 | $38,975 |
| Interquartile 25% (IQ1) | $34,375 | $28,607 |
| Interquartile 75% (IQ3) | $38,681 | $45,877 |
| Interquartile Range (IQR) | $4,306 | $17,270 |
| Standard Deviation (Sample) | $2,956 | $16,714 |
| Standard Deviation (Population) | $2,949 | $16,451 |
Similar Demographics by Median Female Earnings
Demographics Similar to Whites/Caucasians by Median Female Earnings
In terms of median female earnings, the demographic groups most similar to Whites/Caucasians are Colville ($37,514, a difference of 0.040%), Samoan ($37,498, a difference of 0.090%), Hawaiian ($37,497, a difference of 0.090%), Belizean ($37,429, a difference of 0.27%), and Scotch-Irish ($37,383, a difference of 0.39%).
| Demographics | Rating | Rank | Median Female Earnings |
| Immigrants | Somalia | 2.4 /100 | #247 | Tragic $37,914 |
| Alaskan Athabascans | 2.3 /100 | #248 | Tragic $37,905 |
| Swiss | 2.3 /100 | #249 | Tragic $37,904 |
| Immigrants | Iraq | 2.2 /100 | #250 | Tragic $37,864 |
| Welsh | 2.1 /100 | #251 | Tragic $37,856 |
| Immigrants | Dominica | 2.0 /100 | #252 | Tragic $37,825 |
| Danes | 1.6 /100 | #253 | Tragic $37,730 |
| Whites/Caucasians | 1.1 /100 | #254 | Tragic $37,531 |
| Colville | 1.1 /100 | #255 | Tragic $37,514 |
| Samoans | 1.0 /100 | #256 | Tragic $37,498 |
| Hawaiians | 1.0 /100 | #257 | Tragic $37,497 |
| Belizeans | 0.9 /100 | #258 | Tragic $37,429 |
| Scotch-Irish | 0.8 /100 | #259 | Tragic $37,383 |
| Dutch | 0.7 /100 | #260 | Tragic $37,339 |
| Malaysians | 0.7 /100 | #261 | Tragic $37,298 |
Demographics Similar to Immigrants from South Africa by Median Female Earnings
In terms of median female earnings, the demographic groups most similar to Immigrants from South Africa are Mongolian ($42,542, a difference of 0.080%), New Zealander ($42,446, a difference of 0.15%), Immigrants from Italy ($42,446, a difference of 0.15%), Albanian ($42,584, a difference of 0.18%), and Immigrants from Albania ($42,388, a difference of 0.28%).
| Demographics | Rating | Rank | Median Female Earnings |
| Immigrants | Egypt | 99.9 /100 | #67 | Exceptional $42,837 |
| Immigrants | Austria | 99.8 /100 | #68 | Exceptional $42,824 |
| Immigrants | Spain | 99.8 /100 | #69 | Exceptional $42,815 |
| Immigrants | Ethiopia | 99.8 /100 | #70 | Exceptional $42,744 |
| Immigrants | Romania | 99.8 /100 | #71 | Exceptional $42,718 |
| Albanians | 99.8 /100 | #72 | Exceptional $42,584 |
| Mongolians | 99.7 /100 | #73 | Exceptional $42,542 |
| Immigrants | South Africa | 99.7 /100 | #74 | Exceptional $42,508 |
| New Zealanders | 99.7 /100 | #75 | Exceptional $42,446 |
| Immigrants | Italy | 99.7 /100 | #76 | Exceptional $42,446 |
| Immigrants | Albania | 99.6 /100 | #77 | Exceptional $42,388 |
| Immigrants | Kazakhstan | 99.6 /100 | #78 | Exceptional $42,386 |
| Greeks | 99.6 /100 | #79 | Exceptional $42,336 |
| Immigrants | Moldova | 99.6 /100 | #80 | Exceptional $42,304 |
| Immigrants | Southern Europe | 99.5 /100 | #81 | Exceptional $42,275 |