Menominee vs Serbian Per Capita Income
COMPARE
Menominee
Serbian
Per Capita Income
Per Capita Income Comparison
Menominee
Serbians
$34,578
PER CAPITA INCOME
0.0/ 100
METRIC RATING
328th/ 347
METRIC RANK
$46,551
PER CAPITA INCOME
96.2/ 100
METRIC RATING
107th/ 347
METRIC RANK
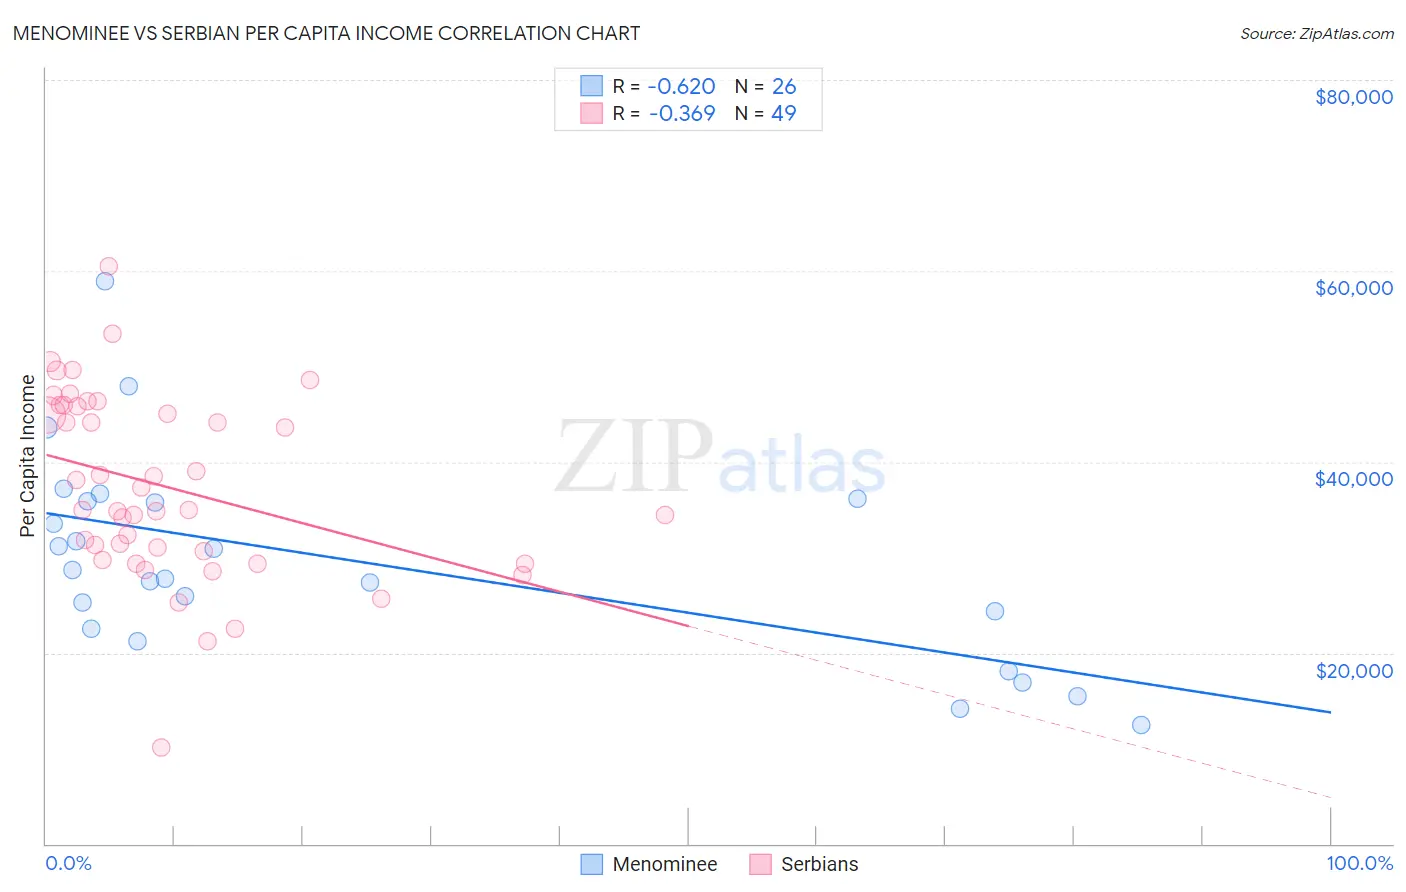
Menominee vs Serbian Per Capita Income Correlation Chart
The statistical analysis conducted on geographies consisting of 45,778,979 people shows a significant negative correlation between the proportion of Menominee and per capita income in the United States with a correlation coefficient (R) of -0.620 and weighted average of $34,578. Similarly, the statistical analysis conducted on geographies consisting of 267,655,306 people shows a mild negative correlation between the proportion of Serbians and per capita income in the United States with a correlation coefficient (R) of -0.369 and weighted average of $46,551, a difference of 34.6%.
Per Capita Income Correlation Summary
| Measurement | Menominee | Serbian |
| Minimum | $12,454 | $10,108 |
| Maximum | $58,872 | $60,445 |
| Range | $46,418 | $50,337 |
| Mean | $29,500 | $37,423 |
| Median | $28,225 | $35,016 |
| Interquartile 25% (IQ1) | $22,568 | $30,161 |
| Interquartile 75% (IQ3) | $35,908 | $45,911 |
| Interquartile Range (IQR) | $13,340 | $15,749 |
| Standard Deviation (Sample) | $10,696 | $9,694 |
| Standard Deviation (Population) | $10,488 | $9,595 |
Similar Demographics by Per Capita Income
Demographics Similar to Menominee by Per Capita Income
In terms of per capita income, the demographic groups most similar to Menominee are Mexican ($34,559, a difference of 0.060%), Apache ($34,886, a difference of 0.89%), Immigrants from Cuba ($34,910, a difference of 0.96%), Spanish American Indian ($34,195, a difference of 1.1%), and Immigrants from Central America ($34,974, a difference of 1.1%).
| Demographics | Rating | Rank | Per Capita Income |
| Blacks/African Americans | 0.0 /100 | #321 | Tragic $35,564 |
| Creek | 0.0 /100 | #322 | Tragic $35,546 |
| Cheyenne | 0.0 /100 | #323 | Tragic $35,276 |
| Kiowa | 0.0 /100 | #324 | Tragic $35,102 |
| Immigrants | Central America | 0.0 /100 | #325 | Tragic $34,974 |
| Immigrants | Cuba | 0.0 /100 | #326 | Tragic $34,910 |
| Apache | 0.0 /100 | #327 | Tragic $34,886 |
| Menominee | 0.0 /100 | #328 | Tragic $34,578 |
| Mexicans | 0.0 /100 | #329 | Tragic $34,559 |
| Spanish American Indians | 0.0 /100 | #330 | Tragic $34,195 |
| Immigrants | Mexico | 0.0 /100 | #331 | Tragic $33,931 |
| Sioux | 0.0 /100 | #332 | Tragic $33,921 |
| Immigrants | Yemen | 0.0 /100 | #333 | Tragic $33,696 |
| Natives/Alaskans | 0.0 /100 | #334 | Tragic $33,279 |
| Yuman | 0.0 /100 | #335 | Tragic $33,236 |
Demographics Similar to Serbians by Per Capita Income
In terms of per capita income, the demographic groups most similar to Serbians are Immigrants from Kuwait ($46,543, a difference of 0.020%), British ($46,571, a difference of 0.040%), Ethiopian ($46,569, a difference of 0.040%), Immigrants from Northern Africa ($46,531, a difference of 0.040%), and Chilean ($46,459, a difference of 0.20%).
| Demographics | Rating | Rank | Per Capita Income |
| Immigrants | Lebanon | 97.5 /100 | #100 | Exceptional $46,938 |
| Immigrants | Uzbekistan | 97.5 /100 | #101 | Exceptional $46,929 |
| Immigrants | Western Asia | 97.4 /100 | #102 | Exceptional $46,876 |
| Syrians | 97.2 /100 | #103 | Exceptional $46,837 |
| Brazilians | 96.8 /100 | #104 | Exceptional $46,700 |
| British | 96.3 /100 | #105 | Exceptional $46,571 |
| Ethiopians | 96.3 /100 | #106 | Exceptional $46,569 |
| Serbians | 96.2 /100 | #107 | Exceptional $46,551 |
| Immigrants | Kuwait | 96.2 /100 | #108 | Exceptional $46,543 |
| Immigrants | Northern Africa | 96.2 /100 | #109 | Exceptional $46,531 |
| Chileans | 95.9 /100 | #110 | Exceptional $46,459 |
| Taiwanese | 95.8 /100 | #111 | Exceptional $46,455 |
| Immigrants | Morocco | 95.7 /100 | #112 | Exceptional $46,430 |
| Immigrants | Albania | 95.5 /100 | #113 | Exceptional $46,387 |
| Afghans | 94.9 /100 | #114 | Exceptional $46,268 |