White/Caucasian vs Immigrants from Cabo Verde 11th Grade
COMPARE
White/Caucasian
Immigrants from Cabo Verde
11th Grade
11th Grade Comparison
Whites/Caucasians
Immigrants from Cabo Verde
93.3%
11TH GRADE
97.4/ 100
METRIC RATING
117th/ 347
METRIC RANK
87.6%
11TH GRADE
0.0/ 100
METRIC RATING
327th/ 347
METRIC RANK
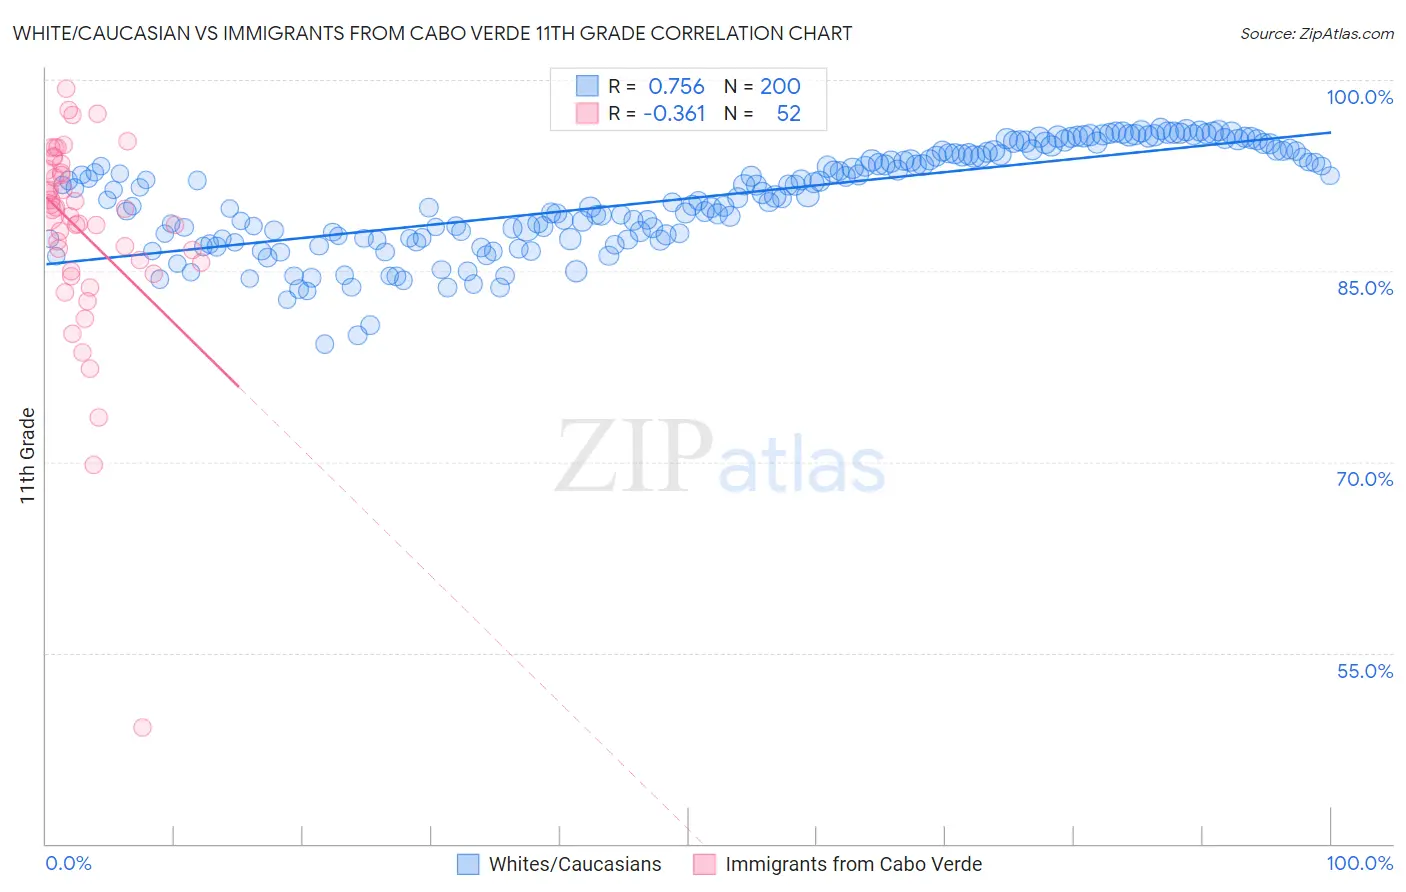
White/Caucasian vs Immigrants from Cabo Verde 11th Grade Correlation Chart
The statistical analysis conducted on geographies consisting of 585,244,244 people shows a strong positive correlation between the proportion of Whites/Caucasians and percentage of population with at least 11th grade education in the United States with a correlation coefficient (R) of 0.756 and weighted average of 93.3%. Similarly, the statistical analysis conducted on geographies consisting of 38,158,504 people shows a mild negative correlation between the proportion of Immigrants from Cabo Verde and percentage of population with at least 11th grade education in the United States with a correlation coefficient (R) of -0.361 and weighted average of 87.6%, a difference of 6.5%.
11th Grade Correlation Summary
| Measurement | White/Caucasian | Immigrants from Cabo Verde |
| Minimum | 79.2% | 49.2% |
| Maximum | 96.1% | 99.3% |
| Range | 16.9% | 50.1% |
| Mean | 90.7% | 88.0% |
| Median | 91.0% | 89.7% |
| Interquartile 25% (IQ1) | 87.6% | 85.3% |
| Interquartile 75% (IQ3) | 94.2% | 92.8% |
| Interquartile Range (IQR) | 6.7% | 7.5% |
| Standard Deviation (Sample) | 4.0% | 8.1% |
| Standard Deviation (Population) | 3.9% | 8.0% |
Similar Demographics by 11th Grade
Demographics Similar to Whites/Caucasians by 11th Grade
In terms of 11th grade, the demographic groups most similar to Whites/Caucasians are Immigrants from Hungary (93.4%, a difference of 0.010%), Palestinian (93.4%, a difference of 0.030%), Jordanian (93.4%, a difference of 0.040%), Immigrants from Korea (93.3%, a difference of 0.040%), and Israeli (93.3%, a difference of 0.040%).
| Demographics | Rating | Rank | 11th Grade |
| Syrians | 98.4 /100 | #110 | Exceptional 93.4% |
| Yugoslavians | 98.1 /100 | #111 | Exceptional 93.4% |
| Immigrants | Germany | 98.0 /100 | #112 | Exceptional 93.4% |
| Immigrants | Zimbabwe | 97.8 /100 | #113 | Exceptional 93.4% |
| Jordanians | 97.8 /100 | #114 | Exceptional 93.4% |
| Palestinians | 97.7 /100 | #115 | Exceptional 93.4% |
| Immigrants | Hungary | 97.5 /100 | #116 | Exceptional 93.4% |
| Whites/Caucasians | 97.4 /100 | #117 | Exceptional 93.3% |
| Immigrants | Korea | 97.0 /100 | #118 | Exceptional 93.3% |
| Israelis | 97.0 /100 | #119 | Exceptional 93.3% |
| Immigrants | Russia | 96.6 /100 | #120 | Exceptional 93.3% |
| German Russians | 96.4 /100 | #121 | Exceptional 93.3% |
| Immigrants | Belarus | 96.3 /100 | #122 | Exceptional 93.3% |
| Immigrants | Greece | 95.9 /100 | #123 | Exceptional 93.2% |
| Immigrants | Eastern Europe | 95.9 /100 | #124 | Exceptional 93.2% |
Demographics Similar to Immigrants from Cabo Verde by 11th Grade
In terms of 11th grade, the demographic groups most similar to Immigrants from Cabo Verde are Dominican (87.7%, a difference of 0.020%), Tohono O'odham (87.6%, a difference of 0.060%), Mexican American Indian (87.5%, a difference of 0.13%), Honduran (87.4%, a difference of 0.31%), and Hispanic or Latino (87.3%, a difference of 0.38%).
| Demographics | Rating | Rank | 11th Grade |
| Immigrants | Armenia | 0.0 /100 | #320 | Tragic 88.8% |
| Immigrants | Belize | 0.0 /100 | #321 | Tragic 88.7% |
| Puerto Ricans | 0.0 /100 | #322 | Tragic 88.4% |
| Pima | 0.0 /100 | #323 | Tragic 88.3% |
| Central American Indians | 0.0 /100 | #324 | Tragic 88.2% |
| Immigrants | Nicaragua | 0.0 /100 | #325 | Tragic 88.1% |
| Dominicans | 0.0 /100 | #326 | Tragic 87.7% |
| Immigrants | Cabo Verde | 0.0 /100 | #327 | Tragic 87.6% |
| Tohono O'odham | 0.0 /100 | #328 | Tragic 87.6% |
| Mexican American Indians | 0.0 /100 | #329 | Tragic 87.5% |
| Hondurans | 0.0 /100 | #330 | Tragic 87.4% |
| Hispanics or Latinos | 0.0 /100 | #331 | Tragic 87.3% |
| Immigrants | Azores | 0.0 /100 | #332 | Tragic 87.2% |
| Immigrants | Yemen | 0.0 /100 | #333 | Tragic 87.1% |
| Houma | 0.0 /100 | #334 | Tragic 87.0% |