White/Caucasian vs Immigrants from Belgium Median Family Income
COMPARE
White/Caucasian
Immigrants from Belgium
Median Family Income
Median Family Income Comparison
Whites/Caucasians
Immigrants from Belgium
$99,800
MEDIAN FAMILY INCOME
18.7/ 100
METRIC RATING
202nd/ 347
METRIC RANK
$123,831
MEDIAN FAMILY INCOME
100.0/ 100
METRIC RATING
19th/ 347
METRIC RANK
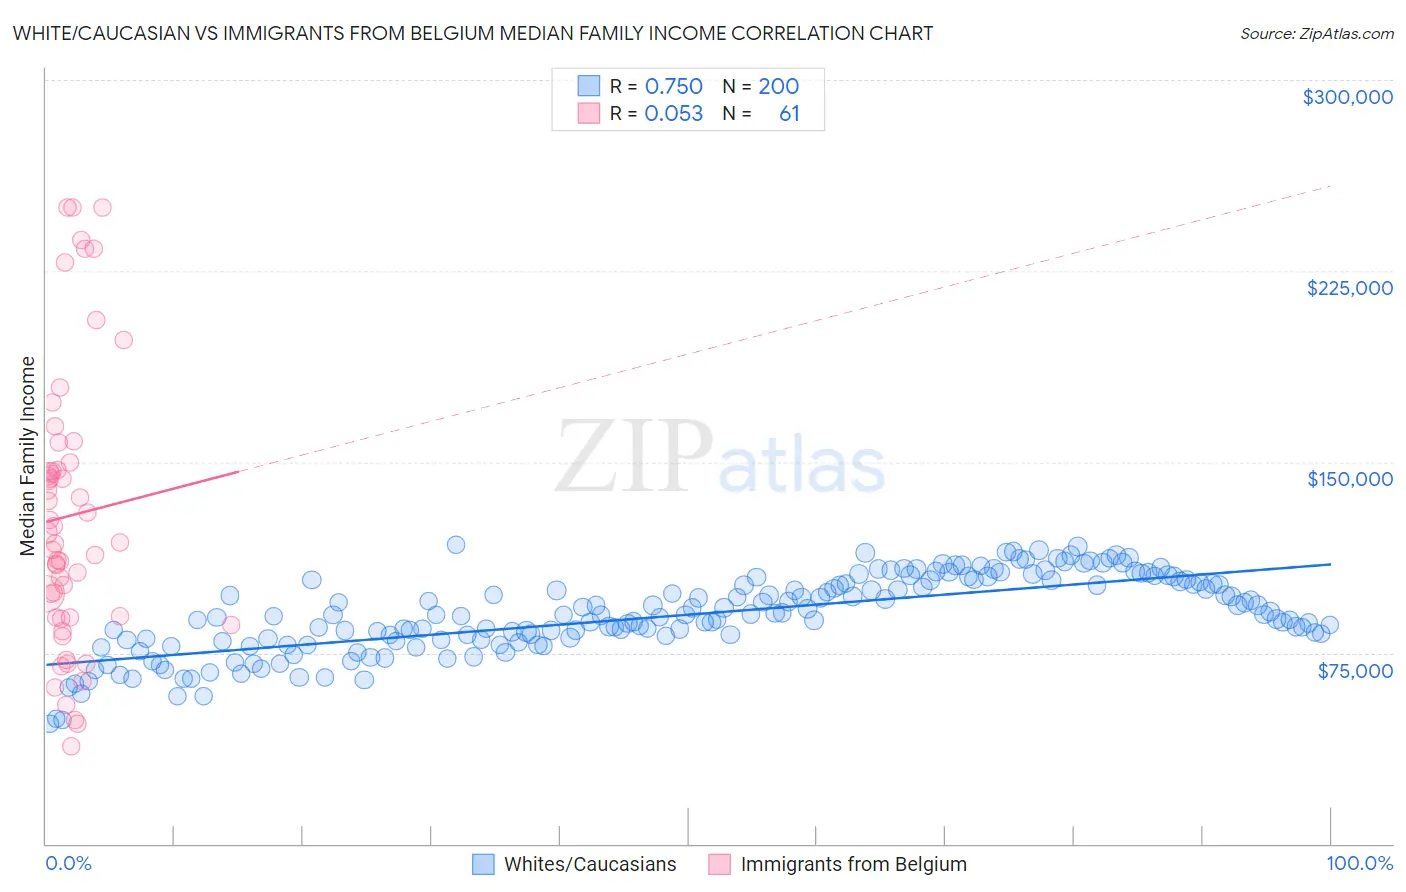
White/Caucasian vs Immigrants from Belgium Median Family Income Correlation Chart
The statistical analysis conducted on geographies consisting of 582,814,142 people shows a strong positive correlation between the proportion of Whites/Caucasians and median family income in the United States with a correlation coefficient (R) of 0.750 and weighted average of $99,800. Similarly, the statistical analysis conducted on geographies consisting of 146,657,089 people shows a slight positive correlation between the proportion of Immigrants from Belgium and median family income in the United States with a correlation coefficient (R) of 0.053 and weighted average of $123,831, a difference of 24.1%.
Median Family Income Correlation Summary
| Measurement | White/Caucasian | Immigrants from Belgium |
| Minimum | $47,087 | $38,056 |
| Maximum | $117,539 | $250,001 |
| Range | $70,452 | $211,945 |
| Mean | $89,997 | $128,845 |
| Median | $89,813 | $118,563 |
| Interquartile 25% (IQ1) | $80,036 | $88,684 |
| Interquartile 75% (IQ3) | $102,904 | $148,325 |
| Interquartile Range (IQR) | $22,868 | $59,642 |
| Standard Deviation (Sample) | $15,237 | $54,287 |
| Standard Deviation (Population) | $15,199 | $53,840 |
Similar Demographics by Median Family Income
Demographics Similar to Whites/Caucasians by Median Family Income
In terms of median family income, the demographic groups most similar to Whites/Caucasians are Immigrants from Thailand ($99,840, a difference of 0.040%), Spanish ($99,977, a difference of 0.18%), Scotch-Irish ($99,591, a difference of 0.21%), Yugoslavian ($100,119, a difference of 0.32%), and Immigrants from Africa ($100,256, a difference of 0.46%).
| Demographics | Rating | Rank | Median Family Income |
| Immigrants | South America | 23.9 /100 | #195 | Fair $100,414 |
| Samoans | 23.3 /100 | #196 | Fair $100,344 |
| Immigrants | Cameroon | 22.8 /100 | #197 | Fair $100,289 |
| Immigrants | Africa | 22.5 /100 | #198 | Fair $100,256 |
| Yugoslavians | 21.3 /100 | #199 | Fair $100,119 |
| Spanish | 20.1 /100 | #200 | Fair $99,977 |
| Immigrants | Thailand | 19.0 /100 | #201 | Poor $99,840 |
| Whites/Caucasians | 18.7 /100 | #202 | Poor $99,800 |
| Scotch-Irish | 17.1 /100 | #203 | Poor $99,591 |
| Ghanaians | 12.6 /100 | #204 | Poor $98,877 |
| Hawaiians | 12.5 /100 | #205 | Poor $98,869 |
| Immigrants | Iraq | 12.1 /100 | #206 | Poor $98,786 |
| Aleuts | 11.6 /100 | #207 | Poor $98,702 |
| Immigrants | Uruguay | 9.2 /100 | #208 | Tragic $98,205 |
| Immigrants | Colombia | 8.7 /100 | #209 | Tragic $98,067 |
Demographics Similar to Immigrants from Belgium by Median Family Income
In terms of median family income, the demographic groups most similar to Immigrants from Belgium are Burmese ($123,369, a difference of 0.37%), Immigrants from Korea ($122,800, a difference of 0.84%), Immigrants from Sweden ($122,765, a difference of 0.87%), Immigrants from Japan ($122,764, a difference of 0.87%), and Immigrants from Eastern Asia ($125,150, a difference of 1.1%).
| Demographics | Rating | Rank | Median Family Income |
| Cypriots | 100.0 /100 | #12 | Exceptional $127,064 |
| Immigrants | Australia | 100.0 /100 | #13 | Exceptional $126,620 |
| Immigrants | South Central Asia | 100.0 /100 | #14 | Exceptional $125,956 |
| Eastern Europeans | 100.0 /100 | #15 | Exceptional $125,546 |
| Immigrants | China | 100.0 /100 | #16 | Exceptional $125,540 |
| Indians (Asian) | 100.0 /100 | #17 | Exceptional $125,312 |
| Immigrants | Eastern Asia | 100.0 /100 | #18 | Exceptional $125,150 |
| Immigrants | Belgium | 100.0 /100 | #19 | Exceptional $123,831 |
| Burmese | 100.0 /100 | #20 | Exceptional $123,369 |
| Immigrants | Korea | 100.0 /100 | #21 | Exceptional $122,800 |
| Immigrants | Sweden | 100.0 /100 | #22 | Exceptional $122,765 |
| Immigrants | Japan | 100.0 /100 | #23 | Exceptional $122,764 |
| Immigrants | Northern Europe | 100.0 /100 | #24 | Exceptional $121,840 |
| Turks | 100.0 /100 | #25 | Exceptional $121,202 |
| Immigrants | Switzerland | 100.0 /100 | #26 | Exceptional $120,726 |