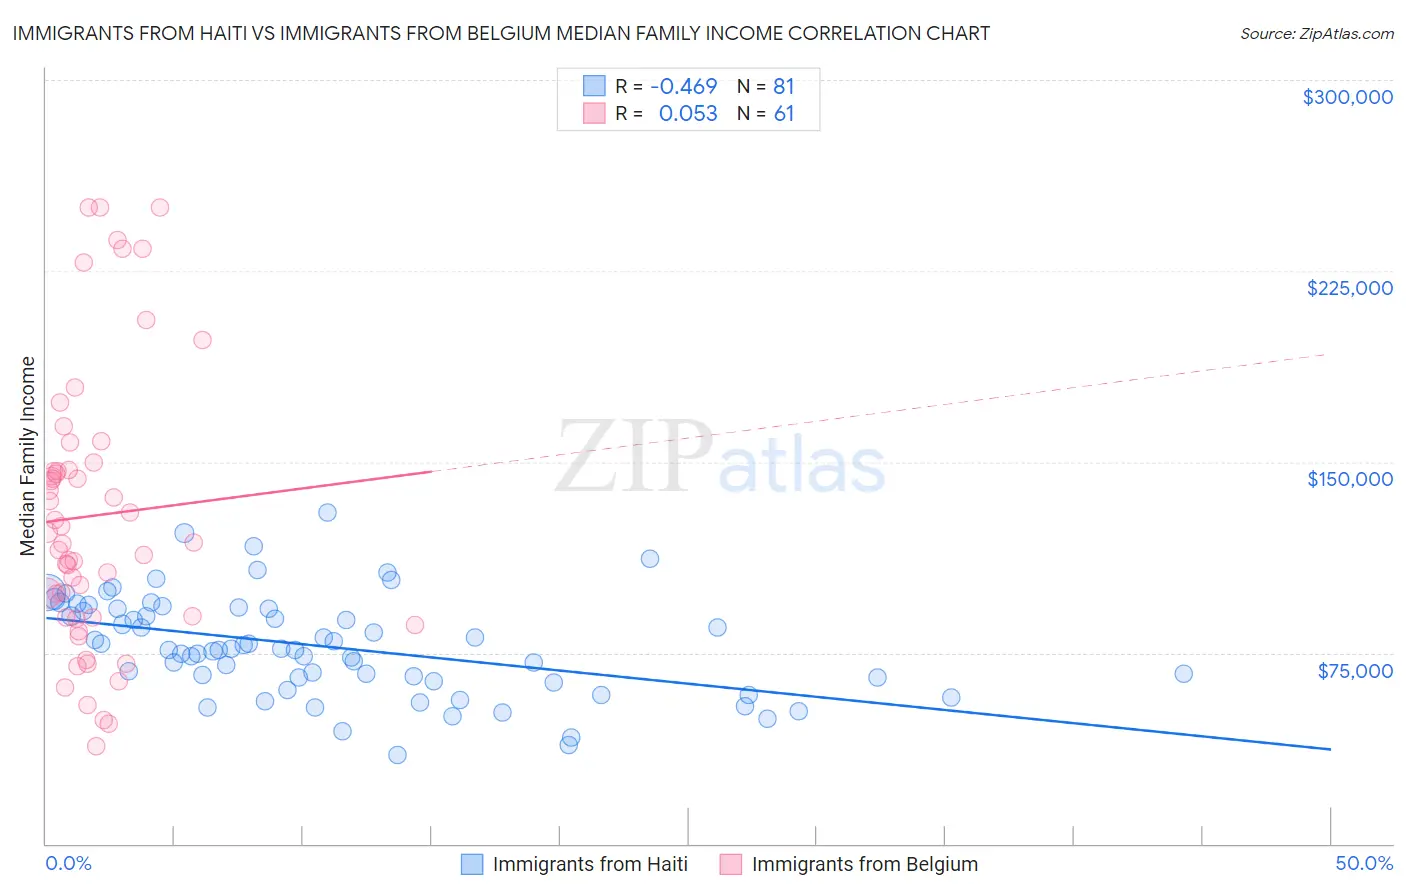
Immigrants from Haiti vs Immigrants from Belgium Median Family Income
COMPARE
Immigrants from Haiti
Immigrants from Belgium
Median Family Income
Median Family Income Comparison
Immigrants from Haiti
Immigrants from Belgium
$84,018
MEDIAN FAMILY INCOME
0.0/ 100
METRIC RATING
316th/ 347
METRIC RANK
$123,831
MEDIAN FAMILY INCOME
100.0/ 100
METRIC RATING
19th/ 347
METRIC RANK
Immigrants from Haiti vs Immigrants from Belgium Median Family Income Correlation Chart
The statistical analysis conducted on geographies consisting of 225,107,869 people shows a moderate negative correlation between the proportion of Immigrants from Haiti and median family income in the United States with a correlation coefficient (R) of -0.469 and weighted average of $84,018. Similarly, the statistical analysis conducted on geographies consisting of 146,657,089 people shows a slight positive correlation between the proportion of Immigrants from Belgium and median family income in the United States with a correlation coefficient (R) of 0.053 and weighted average of $123,831, a difference of 47.4%.
Median Family Income Correlation Summary
| Measurement | Immigrants from Haiti | Immigrants from Belgium |
| Minimum | $34,916 | $38,056 |
| Maximum | $130,212 | $250,001 |
| Range | $95,296 | $211,945 |
| Mean | $77,415 | $128,845 |
| Median | $76,203 | $118,563 |
| Interquartile 25% (IQ1) | $64,411 | $88,684 |
| Interquartile 75% (IQ3) | $92,467 | $148,325 |
| Interquartile Range (IQR) | $28,056 | $59,642 |
| Standard Deviation (Sample) | $19,581 | $54,287 |
| Standard Deviation (Population) | $19,460 | $53,840 |
Similar Demographics by Median Family Income
Demographics Similar to Immigrants from Haiti by Median Family Income
In terms of median family income, the demographic groups most similar to Immigrants from Haiti are Yakama ($83,932, a difference of 0.10%), Immigrants from Mexico ($83,639, a difference of 0.45%), Immigrants from Honduras ($83,618, a difference of 0.48%), Apache ($84,451, a difference of 0.52%), and Seminole ($83,354, a difference of 0.80%).
| Demographics | Rating | Rank | Median Family Income |
| Haitians | 0.0 /100 | #309 | Tragic $85,218 |
| Immigrants | Central America | 0.0 /100 | #310 | Tragic $85,050 |
| Hondurans | 0.0 /100 | #311 | Tragic $85,004 |
| Cubans | 0.0 /100 | #312 | Tragic $84,981 |
| Choctaw | 0.0 /100 | #313 | Tragic $84,835 |
| Immigrants | Bahamas | 0.0 /100 | #314 | Tragic $84,732 |
| Apache | 0.0 /100 | #315 | Tragic $84,451 |
| Immigrants | Haiti | 0.0 /100 | #316 | Tragic $84,018 |
| Yakama | 0.0 /100 | #317 | Tragic $83,932 |
| Immigrants | Mexico | 0.0 /100 | #318 | Tragic $83,639 |
| Immigrants | Honduras | 0.0 /100 | #319 | Tragic $83,618 |
| Seminole | 0.0 /100 | #320 | Tragic $83,354 |
| Immigrants | Caribbean | 0.0 /100 | #321 | Tragic $83,319 |
| Dominicans | 0.0 /100 | #322 | Tragic $82,888 |
| Bahamians | 0.0 /100 | #323 | Tragic $82,631 |
Demographics Similar to Immigrants from Belgium by Median Family Income
In terms of median family income, the demographic groups most similar to Immigrants from Belgium are Burmese ($123,369, a difference of 0.37%), Immigrants from Korea ($122,800, a difference of 0.84%), Immigrants from Sweden ($122,765, a difference of 0.87%), Immigrants from Japan ($122,764, a difference of 0.87%), and Immigrants from Eastern Asia ($125,150, a difference of 1.1%).
| Demographics | Rating | Rank | Median Family Income |
| Cypriots | 100.0 /100 | #12 | Exceptional $127,064 |
| Immigrants | Australia | 100.0 /100 | #13 | Exceptional $126,620 |
| Immigrants | South Central Asia | 100.0 /100 | #14 | Exceptional $125,956 |
| Eastern Europeans | 100.0 /100 | #15 | Exceptional $125,546 |
| Immigrants | China | 100.0 /100 | #16 | Exceptional $125,540 |
| Indians (Asian) | 100.0 /100 | #17 | Exceptional $125,312 |
| Immigrants | Eastern Asia | 100.0 /100 | #18 | Exceptional $125,150 |
| Immigrants | Belgium | 100.0 /100 | #19 | Exceptional $123,831 |
| Burmese | 100.0 /100 | #20 | Exceptional $123,369 |
| Immigrants | Korea | 100.0 /100 | #21 | Exceptional $122,800 |
| Immigrants | Sweden | 100.0 /100 | #22 | Exceptional $122,765 |
| Immigrants | Japan | 100.0 /100 | #23 | Exceptional $122,764 |
| Immigrants | Northern Europe | 100.0 /100 | #24 | Exceptional $121,840 |
| Turks | 100.0 /100 | #25 | Exceptional $121,202 |
| Immigrants | Switzerland | 100.0 /100 | #26 | Exceptional $120,726 |