White/Caucasian vs Sudanese Median Family Income

COMPARE

White/Caucasian
Race
Ancestry
AfghanAfricanAlaska NativeAlaskan AthabascanAlbanianAleutAlsatianAmericanApacheArabArapahoArgentineanArmenianAssyrian/Chaldean/SyriacAustralianAustrianBahamianBangladeshiBarbadianBasqueBelgianBelizeanBermudanBhutaneseBlackfeetBolivianBrazilianBritishBritish West IndianBulgarianBurmeseCajunCambodianCanadianCape VerdeanCarpatho RusynCelticCentral AmericanCentral American IndianCherokeeCheyenneChickasawChileanChineseChippewaChoctawColombianColvilleComancheCosta RicanCreeCreekCroatianCrowCubanCypriotCzechCzechoslovakianDanishDelawareDominicanDutchDutch West IndianEastern EuropeanEcuadorianEgyptianEnglishEstonianEthiopianEuropeanFijianFilipinoFinnishFrenchFrench American IndianFrench CanadianGermanGerman RussianGhanaianGreekGuamanian/ChamorroGuatemalanGuyaneseHaitianHmongHonduranHopiHoumaHungarianIcelanderIndian (Asian)IndonesianInupiatIranianIraqiIrishIroquoisIsraeliItalianJamaicanJapaneseJordanianKenyanKiowaKoreanLaotianLatvianLebaneseLiberianLithuanianLumbeeLuxembourgerMacedonianMalaysianMalteseMarshalleseMenomineeMexicanMexican American IndianMongolianMoroccanNative HawaiianNavajoNepaleseNew ZealanderNicaraguanNigerianNorthern EuropeanNorwegianOkinawanOsageOttawaPaiutePakistaniPalestinianPanamanianParaguayanPennsylvania GermanPeruvianPimaPolishPortuguesePotawatomiPuebloPuerto RicanPuget Sound SalishRomanianRussianSalvadoranSamoanScandinavianScotch-IrishScottishSeminoleSenegaleseSerbianShoshoneSierra LeoneanSiouxSlavicSlovakSloveneSomaliSouth AfricanSouth AmericanSouth American IndianSoviet UnionSpaniardSpanishSpanish AmericanSpanish American IndianSri LankanSubsaharan AfricanSwedishSwissSyrianTaiwaneseThaiTlingit-HaidaTohono O'OdhamTonganTrinidadian and TobagonianTsimshianTurkishU.S. Virgin IslanderUgandanUkrainianUruguayanUteVenezuelanVietnameseWelshWest IndianYakamaYaquiYugoslavianYumanYup'ikZimbabwean
Immigration
NonimmigrantsImmigrantsAfghanistanAfricaAlbaniaArgentinaArmeniaAsiaAustraliaAustriaBahamasBangladeshBarbadosBelarusBelgiumBelizeBoliviaBosnia and HerzegovinaBrazilBulgariaBurma/MyanmarCabo VerdeCambodiaCameroonCanadaCaribbeanCentral AmericaChileChinaColombiaCongoCosta RicaCroatiaCubaCzechoslovakiaDenmarkDominicaDominican RepublicEastern AfricaEastern AsiaEastern EuropeEcuadorEgyptEl SalvadorEnglandEritreaEthiopiaEuropeFijiFranceGermanyGhanaGreeceGrenadaGuatemalaGuyanaHaitiHondurasHong KongHungaryIndiaIndonesiaIranIraqIrelandIsraelItalyJamaicaJapanJordanKazakhstanKenyaKoreaKuwaitLaosLatin AmericaLatviaLebanonLiberiaLithuaniaMalaysiaMexicoMicronesiaMiddle AfricaMoldovaMoroccoNepalNetherlandsNicaraguaNigeriaNorth AmericaNorth MacedoniaNorthern AfricaNorthern EuropeNorwayOceaniaPakistanPanamaPeruPhilippinesPolandPortugalRomaniaRussiaSaudi ArabiaScotlandSenegalSerbiaSierra LeoneSingaporeSomaliaSouth AfricaSouth AmericaSouth Central AsiaSouth Eastern AsiaSouthern EuropeSpainSri LankaSt. Vincent and the GrenadinesSudanSwedenSwitzerlandSyriaTaiwanThailandTrinidad and TobagoTurkeyUgandaUkraineUruguayUzbekistanVenezuelaVietnamWest IndiesWestern AfricaWestern AsiaWestern EuropeYemenZaireZimbabweAzores
Sudanese
Race
Ancestry
AfghanAfricanAlaska NativeAlaskan AthabascanAlbanianAleutAlsatianAmericanApacheArabArapahoArgentineanArmenianAssyrian/Chaldean/SyriacAustralianAustrianBahamianBangladeshiBarbadianBasqueBelgianBelizeanBermudanBhutaneseBlackfeetBolivianBrazilianBritishBritish West IndianBulgarianBurmeseCajunCambodianCanadianCape VerdeanCarpatho RusynCelticCentral AmericanCentral American IndianCherokeeCheyenneChickasawChileanChineseChippewaChoctawColombianColvilleComancheCosta RicanCreeCreekCroatianCrowCubanCypriotCzechCzechoslovakianDanishDelawareDominicanDutchDutch West IndianEastern EuropeanEcuadorianEgyptianEnglishEstonianEthiopianEuropeanFijianFilipinoFinnishFrenchFrench American IndianFrench CanadianGermanGerman RussianGhanaianGreekGuamanian/ChamorroGuatemalanGuyaneseHaitianHmongHonduranHopiHoumaHungarianIcelanderIndian (Asian)IndonesianInupiatIranianIraqiIrishIroquoisIsraeliItalianJamaicanJapaneseJordanianKenyanKiowaKoreanLaotianLatvianLebaneseLiberianLithuanianLumbeeLuxembourgerMacedonianMalaysianMalteseMarshalleseMenomineeMexicanMexican American IndianMongolianMoroccanNative HawaiianNavajoNepaleseNew ZealanderNicaraguanNigerianNorthern EuropeanNorwegianOkinawanOsageOttawaPaiutePakistaniPalestinianPanamanianParaguayanPennsylvania GermanPeruvianPimaPolishPortuguesePotawatomiPuebloPuerto RicanPuget Sound SalishRomanianRussianSalvadoranSamoanScandinavianScotch-IrishScottishSeminoleSenegaleseSerbianShoshoneSierra LeoneanSiouxSlavicSlovakSloveneSomaliSouth AfricanSouth AmericanSouth American IndianSoviet UnionSpaniardSpanishSpanish AmericanSpanish American IndianSri LankanSubsaharan AfricanSudaneseSwedishSwissSyrianTaiwaneseThaiTlingit-HaidaTohono O'OdhamTonganTrinidadian and TobagonianTsimshianTurkishU.S. Virgin IslanderUgandanUkrainianUruguayanUteVenezuelanVietnameseWelshWest IndianYakamaYaquiYugoslavianYumanYup'ikZimbabwean
Immigration
NonimmigrantsImmigrantsAfghanistanAfricaAlbaniaArgentinaArmeniaAsiaAustraliaAustriaBahamasBangladeshBarbadosBelarusBelgiumBelizeBoliviaBosnia and HerzegovinaBrazilBulgariaBurma/MyanmarCabo VerdeCambodiaCameroonCanadaCaribbeanCentral AmericaChileChinaColombiaCongoCosta RicaCroatiaCubaCzechoslovakiaDenmarkDominicaDominican RepublicEastern AfricaEastern AsiaEastern EuropeEcuadorEgyptEl SalvadorEnglandEritreaEthiopiaEuropeFijiFranceGermanyGhanaGreeceGrenadaGuatemalaGuyanaHaitiHondurasHong KongHungaryIndiaIndonesiaIranIraqIrelandIsraelItalyJamaicaJapanJordanKazakhstanKenyaKoreaKuwaitLaosLatin AmericaLatviaLebanonLiberiaLithuaniaMalaysiaMexicoMicronesiaMiddle AfricaMoldovaMoroccoNepalNetherlandsNicaraguaNigeriaNorth AmericaNorth MacedoniaNorthern AfricaNorthern EuropeNorwayOceaniaPakistanPanamaPeruPhilippinesPolandPortugalRomaniaRussiaSaudi ArabiaScotlandSenegalSerbiaSierra LeoneSingaporeSomaliaSouth AfricaSouth AmericaSouth Central AsiaSouth Eastern AsiaSouthern EuropeSpainSri LankaSt. Vincent and the GrenadinesSudanSwedenSwitzerlandSyriaTaiwanThailandTrinidad and TobagoTurkeyUgandaUkraineUruguayUzbekistanVenezuelaVietnamWest IndiesWestern AfricaWestern AsiaWestern EuropeYemenZaireZimbabweAzores
Median Family Income
Income
Poverty
Unemployment
Labor Participation
Family Structure
Vehicle Availability
Education Level
Disability

Median Family Income Comparison

Whites/Caucasians

Sudanese

Poor
Tragic
$99,800
MEDIAN FAMILY INCOME
18.7/ 100
METRIC RATING
202nd/ 347
METRIC RANK
$96,783
MEDIAN FAMILY INCOME
4.7/ 100
METRIC RATING
220th/ 347
METRIC RANK

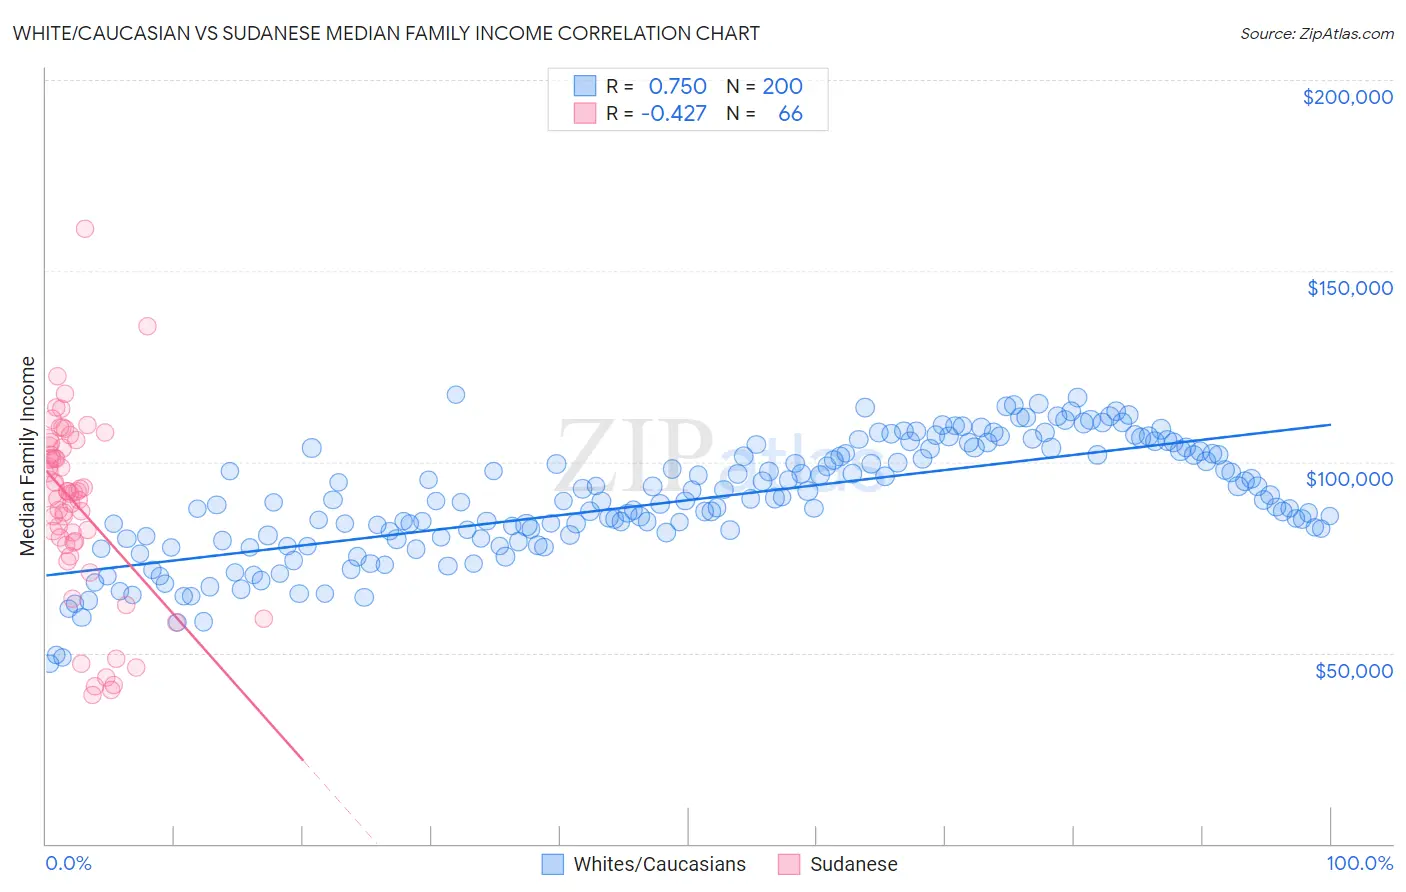
White/Caucasian vs Sudanese Median Family Income Correlation Chart

The statistical analysis conducted on geographies consisting of 582,814,142 people shows a strong positive correlation between the proportion of Whites/Caucasians and median family income in the United States with a correlation coefficient (R) of 0.750 and weighted average of $99,800. Similarly, the statistical analysis conducted on geographies consisting of 110,081,716 people shows a moderate negative correlation between the proportion of Sudanese and median family income in the United States with a correlation coefficient (R) of -0.427 and weighted average of $96,783, a difference of 3.1%.
White/Caucasian vs Sudanese Median Family Income

Median Family Income Correlation Summary

MeasurementWhite/CaucasianSudanese
Minimum$47,087$38,840
Maximum$117,539$160,922
Range$70,452$122,082
Mean$89,997$88,541
Median$89,813$92,056
Interquartile 25% (IQ1)$80,036$78,776
Interquartile 75% (IQ3)$102,904$104,200
Interquartile Range (IQR)$22,868$25,424
Standard Deviation (Sample)$15,237$23,841
Standard Deviation (Population)$15,199$23,660

Demographics Similar to Whites/Caucasians and Sudanese by Median Family Income

In terms of median family income, the demographic groups most similar to Whites/Caucasians are Immigrants from Thailand ($99,840, a difference of 0.040%), Scotch-Irish ($99,591, a difference of 0.21%), Ghanaian ($98,877, a difference of 0.93%), Hawaiian ($98,869, a difference of 0.94%), and Immigrants from Iraq ($98,786, a difference of 1.0%). Similarly, the demographic groups most similar to Sudanese are Delaware ($96,958, a difference of 0.18%), Immigrants from Ghana ($96,544, a difference of 0.25%), Immigrants from Cambodia ($97,222, a difference of 0.45%), Japanese ($97,288, a difference of 0.52%), and Immigrants from Bosnia and Herzegovina ($97,432, a difference of 0.67%).
DemographicsRating | RankMedian Family Income
Immigrants | Thailand
19.0
/100
|
#201
Poor
$99,840
Whites/Caucasians
18.7
/100
|
#202
Poor
$99,800
Scotch-Irish
17.1
/100
|
#203
Poor
$99,591
Ghanaians
12.6
/100
|
#204
Poor
$98,877
Hawaiians
12.5
/100
|
#205
Poor
$98,869
Immigrants | Iraq
12.1
/100
|
#206
Poor
$98,786
Aleuts
11.6
/100
|
#207
Poor
$98,702
Immigrants | Uruguay
9.2
/100
|
#208
Tragic
$98,205
Immigrants | Colombia
8.7
/100
|
#209
Tragic
$98,067
Puget Sound Salish
8.2
/100
|
#210
Tragic
$97,958
Immigrants | Sudan
7.4
/100
|
#211
Tragic
$97,737
Panamanians
7.2
/100
|
#212
Tragic
$97,683
Immigrants | Armenia
7.0
/100
|
#213
Tragic
$97,605
Bermudans
6.9
/100
|
#214
Tragic
$97,577
Nigerians
6.7
/100
|
#215
Tragic
$97,522
Immigrants | Bosnia and Herzegovina
6.4
/100
|
#216
Tragic
$97,432
Japanese
6.0
/100
|
#217
Tragic
$97,288
Immigrants | Cambodia
5.8
/100
|
#218
Tragic
$97,222
Delaware
5.1
/100
|
#219
Tragic
$96,958
Sudanese
4.7
/100
|
#220
Tragic
$96,783
Immigrants | Ghana
4.2
/100
|
#221
Tragic
$96,544