White/Caucasian vs Immigrants from Kazakhstan Median Family Income
COMPARE
White/Caucasian
Immigrants from Kazakhstan
Median Family Income
Median Family Income Comparison
Whites/Caucasians
Immigrants from Kazakhstan
$99,800
MEDIAN FAMILY INCOME
18.7/ 100
METRIC RATING
202nd/ 347
METRIC RANK
$110,137
MEDIAN FAMILY INCOME
97.8/ 100
METRIC RATING
93rd/ 347
METRIC RANK
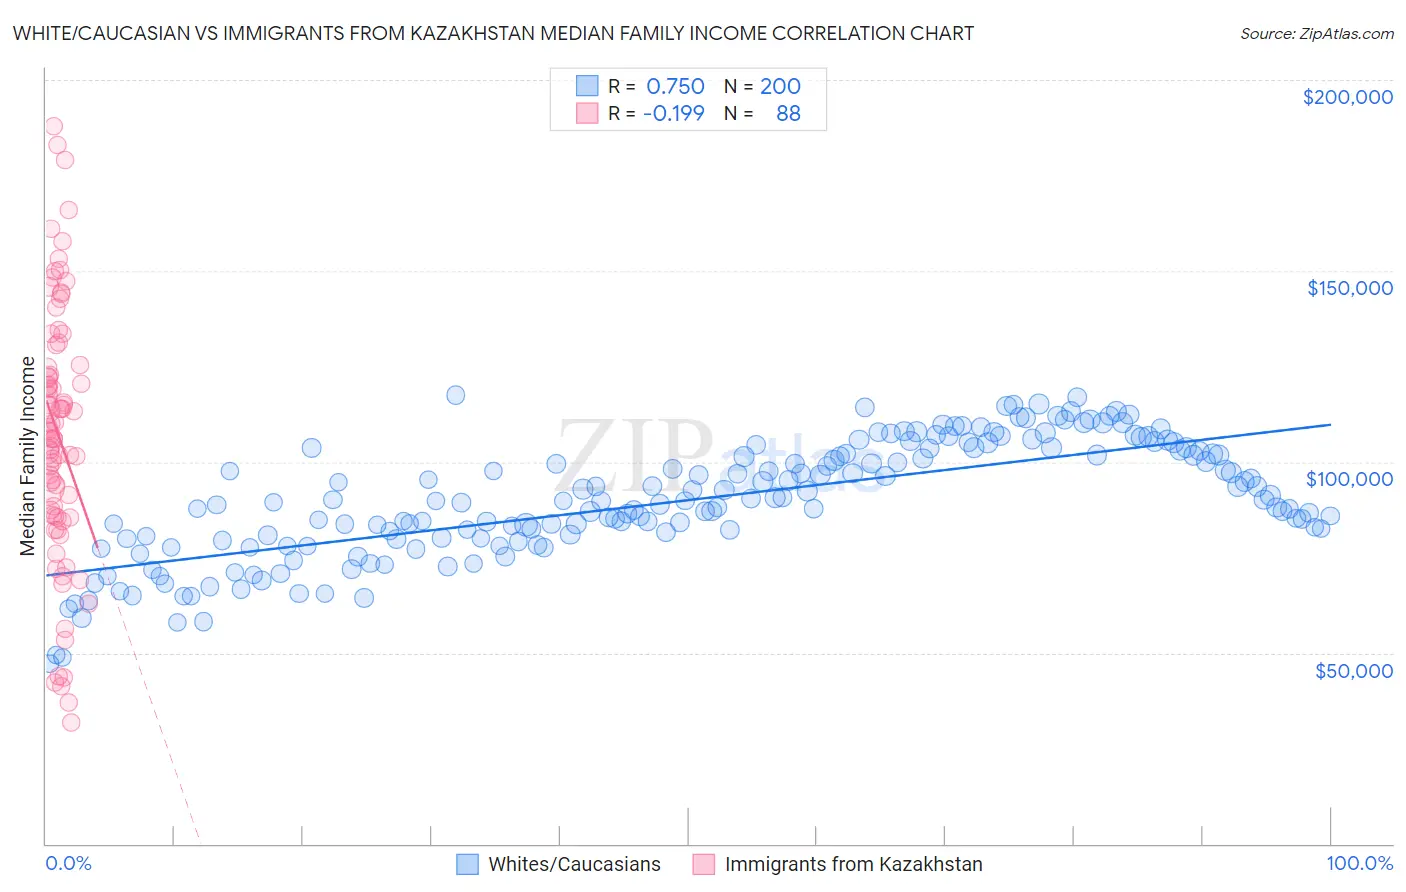
White/Caucasian vs Immigrants from Kazakhstan Median Family Income Correlation Chart
The statistical analysis conducted on geographies consisting of 582,814,142 people shows a strong positive correlation between the proportion of Whites/Caucasians and median family income in the United States with a correlation coefficient (R) of 0.750 and weighted average of $99,800. Similarly, the statistical analysis conducted on geographies consisting of 124,424,095 people shows a poor negative correlation between the proportion of Immigrants from Kazakhstan and median family income in the United States with a correlation coefficient (R) of -0.199 and weighted average of $110,137, a difference of 10.4%.
Median Family Income Correlation Summary
| Measurement | White/Caucasian | Immigrants from Kazakhstan |
| Minimum | $47,087 | $31,653 |
| Maximum | $117,539 | $187,745 |
| Range | $70,452 | $156,092 |
| Mean | $89,997 | $107,291 |
| Median | $89,813 | $107,620 |
| Interquartile 25% (IQ1) | $80,036 | $85,937 |
| Interquartile 75% (IQ3) | $102,904 | $125,121 |
| Interquartile Range (IQR) | $22,868 | $39,184 |
| Standard Deviation (Sample) | $15,237 | $33,362 |
| Standard Deviation (Population) | $15,199 | $33,172 |
Similar Demographics by Median Family Income
Demographics Similar to Whites/Caucasians by Median Family Income
In terms of median family income, the demographic groups most similar to Whites/Caucasians are Immigrants from Thailand ($99,840, a difference of 0.040%), Spanish ($99,977, a difference of 0.18%), Scotch-Irish ($99,591, a difference of 0.21%), Yugoslavian ($100,119, a difference of 0.32%), and Immigrants from Africa ($100,256, a difference of 0.46%).
| Demographics | Rating | Rank | Median Family Income |
| Immigrants | South America | 23.9 /100 | #195 | Fair $100,414 |
| Samoans | 23.3 /100 | #196 | Fair $100,344 |
| Immigrants | Cameroon | 22.8 /100 | #197 | Fair $100,289 |
| Immigrants | Africa | 22.5 /100 | #198 | Fair $100,256 |
| Yugoslavians | 21.3 /100 | #199 | Fair $100,119 |
| Spanish | 20.1 /100 | #200 | Fair $99,977 |
| Immigrants | Thailand | 19.0 /100 | #201 | Poor $99,840 |
| Whites/Caucasians | 18.7 /100 | #202 | Poor $99,800 |
| Scotch-Irish | 17.1 /100 | #203 | Poor $99,591 |
| Ghanaians | 12.6 /100 | #204 | Poor $98,877 |
| Hawaiians | 12.5 /100 | #205 | Poor $98,869 |
| Immigrants | Iraq | 12.1 /100 | #206 | Poor $98,786 |
| Aleuts | 11.6 /100 | #207 | Poor $98,702 |
| Immigrants | Uruguay | 9.2 /100 | #208 | Tragic $98,205 |
| Immigrants | Colombia | 8.7 /100 | #209 | Tragic $98,067 |
Demographics Similar to Immigrants from Kazakhstan by Median Family Income
In terms of median family income, the demographic groups most similar to Immigrants from Kazakhstan are Immigrants from Lebanon ($110,159, a difference of 0.020%), Korean ($110,103, a difference of 0.030%), Zimbabwean ($110,011, a difference of 0.11%), Immigrants from Moldova ($109,975, a difference of 0.15%), and Jordanian ($109,865, a difference of 0.25%).
| Demographics | Rating | Rank | Median Family Income |
| Ukrainians | 98.8 /100 | #86 | Exceptional $111,368 |
| Austrians | 98.8 /100 | #87 | Exceptional $111,306 |
| Romanians | 98.8 /100 | #88 | Exceptional $111,243 |
| Immigrants | Argentina | 98.5 /100 | #89 | Exceptional $110,873 |
| Northern Europeans | 98.3 /100 | #90 | Exceptional $110,635 |
| Immigrants | Southern Europe | 98.3 /100 | #91 | Exceptional $110,614 |
| Immigrants | Lebanon | 97.9 /100 | #92 | Exceptional $110,159 |
| Immigrants | Kazakhstan | 97.8 /100 | #93 | Exceptional $110,137 |
| Koreans | 97.8 /100 | #94 | Exceptional $110,103 |
| Zimbabweans | 97.7 /100 | #95 | Exceptional $110,011 |
| Immigrants | Moldova | 97.7 /100 | #96 | Exceptional $109,975 |
| Jordanians | 97.5 /100 | #97 | Exceptional $109,865 |
| Immigrants | Kuwait | 97.4 /100 | #98 | Exceptional $109,731 |
| Armenians | 97.3 /100 | #99 | Exceptional $109,692 |
| Macedonians | 97.3 /100 | #100 | Exceptional $109,668 |