White/Caucasian vs African Median Family Income
COMPARE
White/Caucasian
African
Median Family Income
Median Family Income Comparison
Whites/Caucasians
Africans
$99,800
MEDIAN FAMILY INCOME
18.7/ 100
METRIC RATING
202nd/ 347
METRIC RANK
$87,820
MEDIAN FAMILY INCOME
0.1/ 100
METRIC RATING
292nd/ 347
METRIC RANK
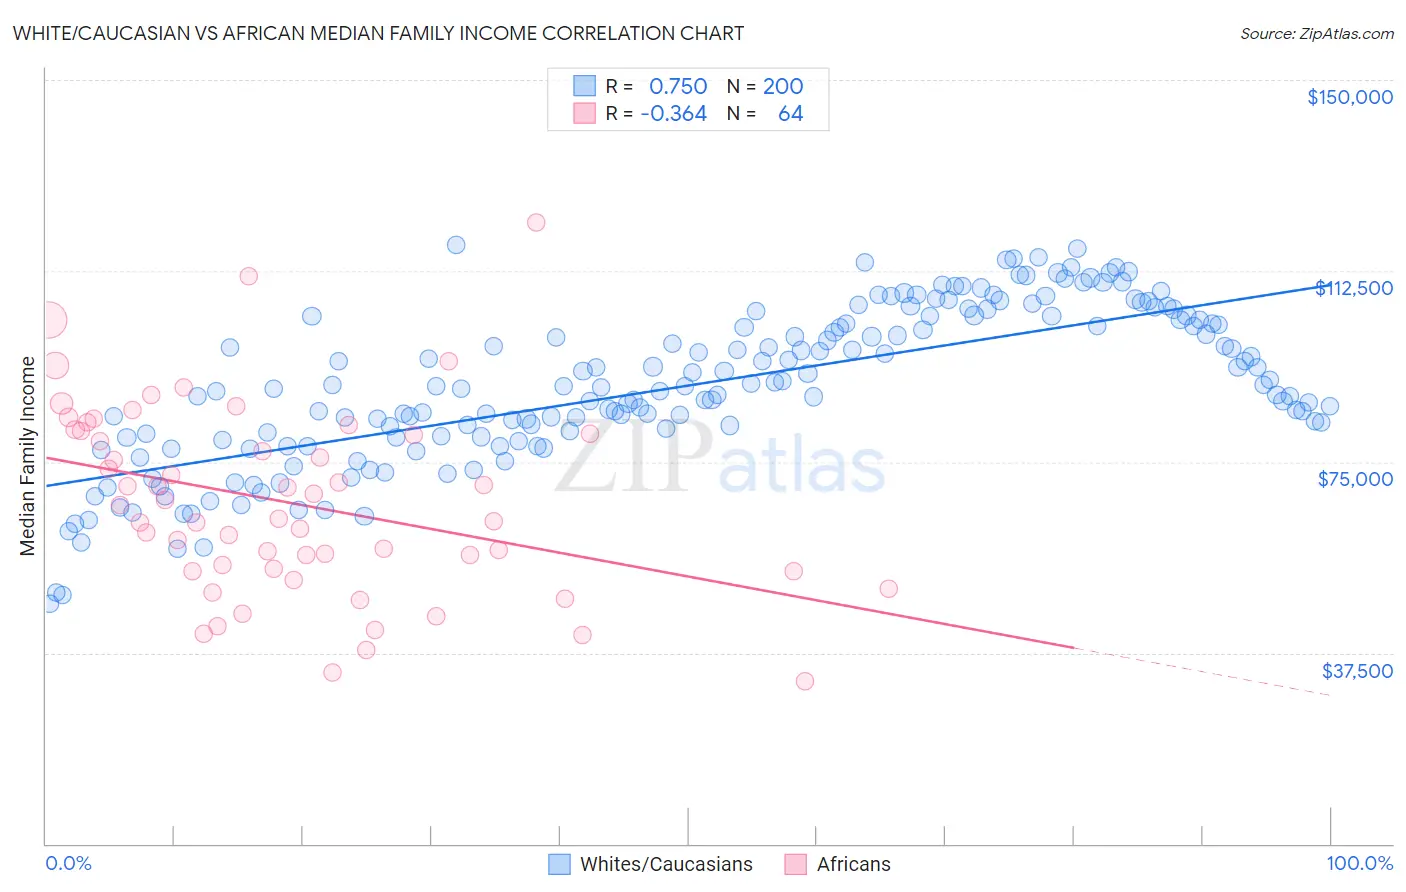
White/Caucasian vs African Median Family Income Correlation Chart
The statistical analysis conducted on geographies consisting of 582,814,142 people shows a strong positive correlation between the proportion of Whites/Caucasians and median family income in the United States with a correlation coefficient (R) of 0.750 and weighted average of $99,800. Similarly, the statistical analysis conducted on geographies consisting of 469,326,799 people shows a mild negative correlation between the proportion of Africans and median family income in the United States with a correlation coefficient (R) of -0.364 and weighted average of $87,820, a difference of 13.6%.
Median Family Income Correlation Summary
| Measurement | White/Caucasian | African |
| Minimum | $47,087 | $32,021 |
| Maximum | $117,539 | $122,080 |
| Range | $70,452 | $90,059 |
| Mean | $89,997 | $66,990 |
| Median | $89,813 | $65,223 |
| Interquartile 25% (IQ1) | $80,036 | $53,783 |
| Interquartile 75% (IQ3) | $102,904 | $80,861 |
| Interquartile Range (IQR) | $22,868 | $27,078 |
| Standard Deviation (Sample) | $15,237 | $18,626 |
| Standard Deviation (Population) | $15,199 | $18,480 |
Similar Demographics by Median Family Income
Demographics Similar to Whites/Caucasians by Median Family Income
In terms of median family income, the demographic groups most similar to Whites/Caucasians are Immigrants from Thailand ($99,840, a difference of 0.040%), Spanish ($99,977, a difference of 0.18%), Scotch-Irish ($99,591, a difference of 0.21%), Yugoslavian ($100,119, a difference of 0.32%), and Immigrants from Africa ($100,256, a difference of 0.46%).
| Demographics | Rating | Rank | Median Family Income |
| Immigrants | South America | 23.9 /100 | #195 | Fair $100,414 |
| Samoans | 23.3 /100 | #196 | Fair $100,344 |
| Immigrants | Cameroon | 22.8 /100 | #197 | Fair $100,289 |
| Immigrants | Africa | 22.5 /100 | #198 | Fair $100,256 |
| Yugoslavians | 21.3 /100 | #199 | Fair $100,119 |
| Spanish | 20.1 /100 | #200 | Fair $99,977 |
| Immigrants | Thailand | 19.0 /100 | #201 | Poor $99,840 |
| Whites/Caucasians | 18.7 /100 | #202 | Poor $99,800 |
| Scotch-Irish | 17.1 /100 | #203 | Poor $99,591 |
| Ghanaians | 12.6 /100 | #204 | Poor $98,877 |
| Hawaiians | 12.5 /100 | #205 | Poor $98,869 |
| Immigrants | Iraq | 12.1 /100 | #206 | Poor $98,786 |
| Aleuts | 11.6 /100 | #207 | Poor $98,702 |
| Immigrants | Uruguay | 9.2 /100 | #208 | Tragic $98,205 |
| Immigrants | Colombia | 8.7 /100 | #209 | Tragic $98,067 |
Demographics Similar to Africans by Median Family Income
In terms of median family income, the demographic groups most similar to Africans are Immigrants from Cabo Verde ($87,830, a difference of 0.010%), Shoshone ($87,872, a difference of 0.060%), Central American Indian ($88,034, a difference of 0.24%), Ute ($87,596, a difference of 0.26%), and Cherokee ($88,209, a difference of 0.44%).
| Demographics | Rating | Rank | Median Family Income |
| Guatemalans | 0.1 /100 | #285 | Tragic $88,295 |
| Immigrants | Nicaragua | 0.1 /100 | #286 | Tragic $88,267 |
| Potawatomi | 0.1 /100 | #287 | Tragic $88,265 |
| Cherokee | 0.1 /100 | #288 | Tragic $88,209 |
| Central American Indians | 0.1 /100 | #289 | Tragic $88,034 |
| Shoshone | 0.1 /100 | #290 | Tragic $87,872 |
| Immigrants | Cabo Verde | 0.1 /100 | #291 | Tragic $87,830 |
| Africans | 0.1 /100 | #292 | Tragic $87,820 |
| Ute | 0.0 /100 | #293 | Tragic $87,596 |
| Fijians | 0.0 /100 | #294 | Tragic $87,387 |
| Yaqui | 0.0 /100 | #295 | Tragic $87,289 |
| Immigrants | Guatemala | 0.0 /100 | #296 | Tragic $87,191 |
| Cajuns | 0.0 /100 | #297 | Tragic $87,157 |
| Immigrants | Latin America | 0.0 /100 | #298 | Tragic $86,989 |
| Chippewa | 0.0 /100 | #299 | Tragic $86,852 |