White/Caucasian vs Immigrants from Switzerland Median Family Income
COMPARE
White/Caucasian
Immigrants from Switzerland
Median Family Income
Median Family Income Comparison
Whites/Caucasians
Immigrants from Switzerland
$99,800
MEDIAN FAMILY INCOME
18.7/ 100
METRIC RATING
202nd/ 347
METRIC RANK
$120,726
MEDIAN FAMILY INCOME
100.0/ 100
METRIC RATING
26th/ 347
METRIC RANK
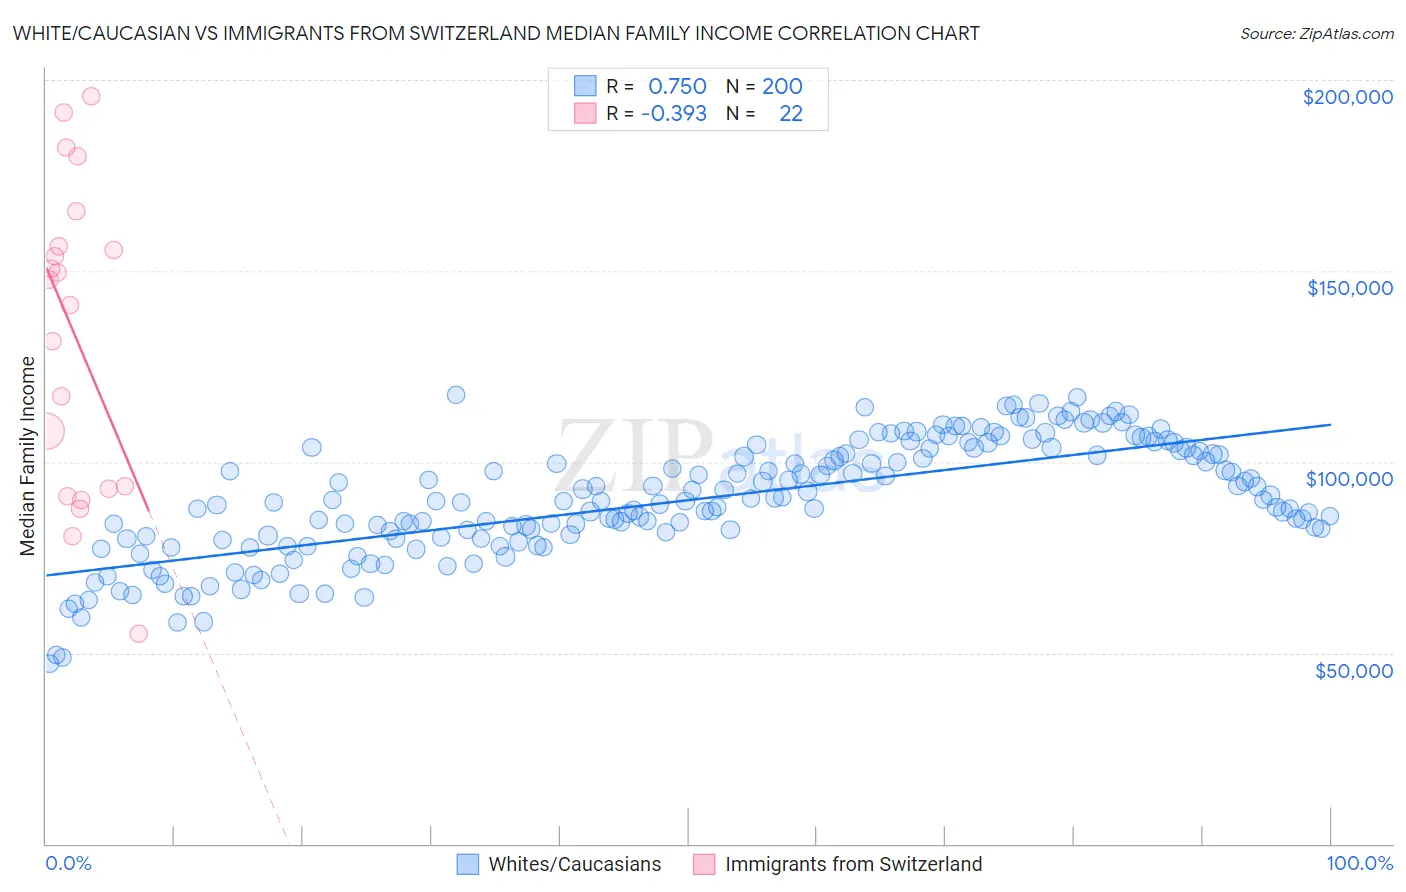
White/Caucasian vs Immigrants from Switzerland Median Family Income Correlation Chart
The statistical analysis conducted on geographies consisting of 582,814,142 people shows a strong positive correlation between the proportion of Whites/Caucasians and median family income in the United States with a correlation coefficient (R) of 0.750 and weighted average of $99,800. Similarly, the statistical analysis conducted on geographies consisting of 148,050,158 people shows a mild negative correlation between the proportion of Immigrants from Switzerland and median family income in the United States with a correlation coefficient (R) of -0.393 and weighted average of $120,726, a difference of 21.0%.
Median Family Income Correlation Summary
| Measurement | White/Caucasian | Immigrants from Switzerland |
| Minimum | $47,087 | $55,000 |
| Maximum | $117,539 | $195,586 |
| Range | $70,452 | $140,586 |
| Mean | $89,997 | $132,599 |
| Median | $89,813 | $144,292 |
| Interquartile 25% (IQ1) | $80,036 | $92,813 |
| Interquartile 75% (IQ3) | $102,904 | $156,420 |
| Interquartile Range (IQR) | $22,868 | $63,607 |
| Standard Deviation (Sample) | $15,237 | $40,204 |
| Standard Deviation (Population) | $15,199 | $39,280 |
Similar Demographics by Median Family Income
Demographics Similar to Whites/Caucasians by Median Family Income
In terms of median family income, the demographic groups most similar to Whites/Caucasians are Immigrants from Thailand ($99,840, a difference of 0.040%), Spanish ($99,977, a difference of 0.18%), Scotch-Irish ($99,591, a difference of 0.21%), Yugoslavian ($100,119, a difference of 0.32%), and Immigrants from Africa ($100,256, a difference of 0.46%).
| Demographics | Rating | Rank | Median Family Income |
| Immigrants | South America | 23.9 /100 | #195 | Fair $100,414 |
| Samoans | 23.3 /100 | #196 | Fair $100,344 |
| Immigrants | Cameroon | 22.8 /100 | #197 | Fair $100,289 |
| Immigrants | Africa | 22.5 /100 | #198 | Fair $100,256 |
| Yugoslavians | 21.3 /100 | #199 | Fair $100,119 |
| Spanish | 20.1 /100 | #200 | Fair $99,977 |
| Immigrants | Thailand | 19.0 /100 | #201 | Poor $99,840 |
| Whites/Caucasians | 18.7 /100 | #202 | Poor $99,800 |
| Scotch-Irish | 17.1 /100 | #203 | Poor $99,591 |
| Ghanaians | 12.6 /100 | #204 | Poor $98,877 |
| Hawaiians | 12.5 /100 | #205 | Poor $98,869 |
| Immigrants | Iraq | 12.1 /100 | #206 | Poor $98,786 |
| Aleuts | 11.6 /100 | #207 | Poor $98,702 |
| Immigrants | Uruguay | 9.2 /100 | #208 | Tragic $98,205 |
| Immigrants | Colombia | 8.7 /100 | #209 | Tragic $98,067 |
Demographics Similar to Immigrants from Switzerland by Median Family Income
In terms of median family income, the demographic groups most similar to Immigrants from Switzerland are Russian ($120,487, a difference of 0.20%), Immigrants from Denmark ($120,445, a difference of 0.23%), Latvian ($120,301, a difference of 0.35%), Turkish ($121,202, a difference of 0.39%), and Immigrants from Sri Lanka ($120,263, a difference of 0.39%).
| Demographics | Rating | Rank | Median Family Income |
| Immigrants | Belgium | 100.0 /100 | #19 | Exceptional $123,831 |
| Burmese | 100.0 /100 | #20 | Exceptional $123,369 |
| Immigrants | Korea | 100.0 /100 | #21 | Exceptional $122,800 |
| Immigrants | Sweden | 100.0 /100 | #22 | Exceptional $122,765 |
| Immigrants | Japan | 100.0 /100 | #23 | Exceptional $122,764 |
| Immigrants | Northern Europe | 100.0 /100 | #24 | Exceptional $121,840 |
| Turks | 100.0 /100 | #25 | Exceptional $121,202 |
| Immigrants | Switzerland | 100.0 /100 | #26 | Exceptional $120,726 |
| Russians | 100.0 /100 | #27 | Exceptional $120,487 |
| Immigrants | Denmark | 100.0 /100 | #28 | Exceptional $120,445 |
| Latvians | 100.0 /100 | #29 | Exceptional $120,301 |
| Immigrants | Sri Lanka | 100.0 /100 | #30 | Exceptional $120,263 |
| Immigrants | France | 100.0 /100 | #31 | Exceptional $120,076 |
| Asians | 100.0 /100 | #32 | Exceptional $119,955 |
| Bhutanese | 100.0 /100 | #33 | Exceptional $119,800 |