Indian (Asian) vs Immigrants from Belgium Median Family Income
COMPARE
Indian (Asian)
Immigrants from Belgium
Median Family Income
Median Family Income Comparison
Indians (Asian)
Immigrants from Belgium
$125,312
MEDIAN FAMILY INCOME
100.0/ 100
METRIC RATING
17th/ 347
METRIC RANK
$123,831
MEDIAN FAMILY INCOME
100.0/ 100
METRIC RATING
19th/ 347
METRIC RANK
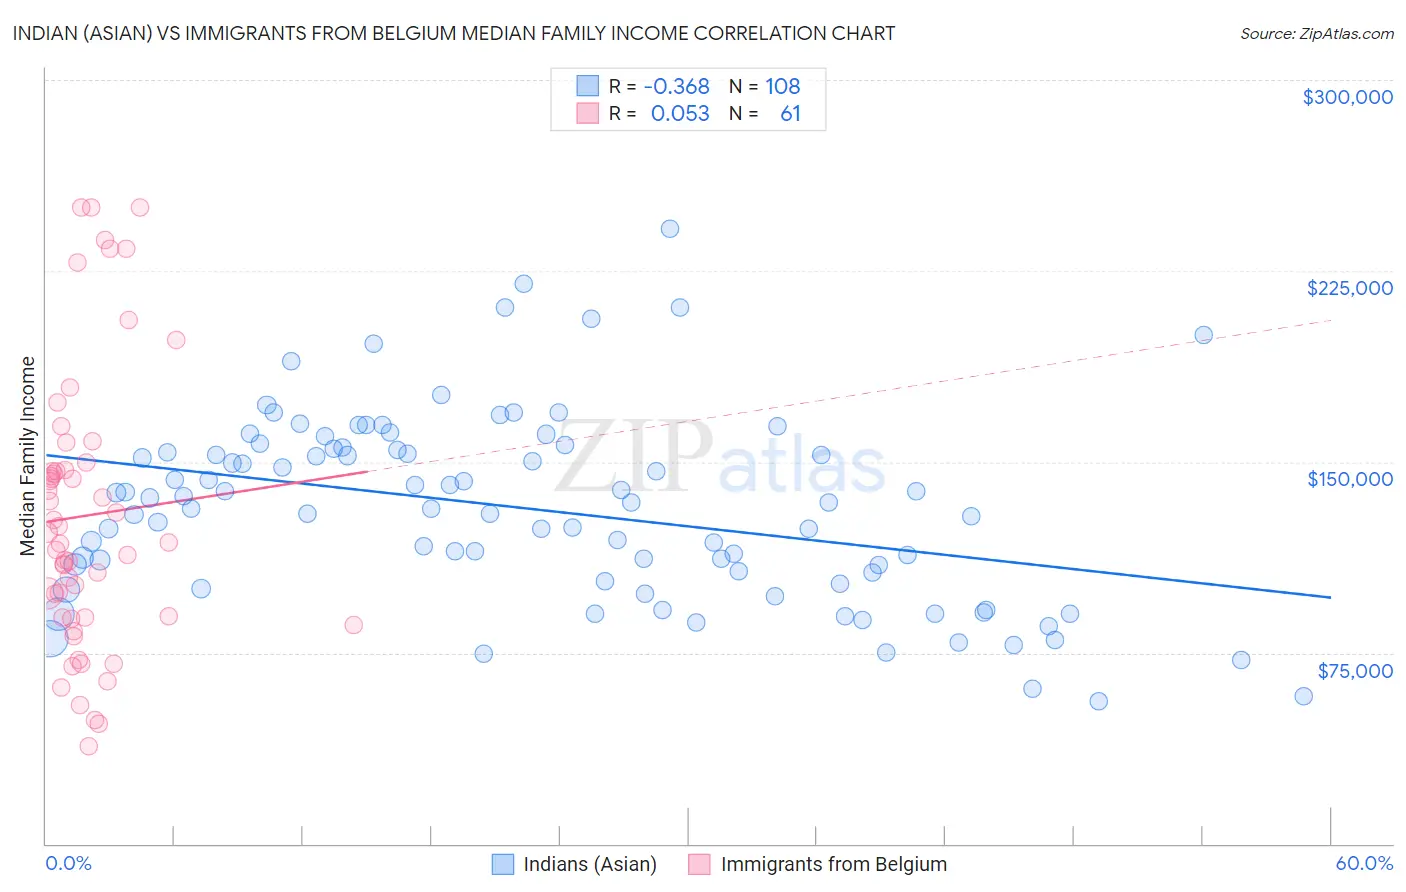
Indian (Asian) vs Immigrants from Belgium Median Family Income Correlation Chart
The statistical analysis conducted on geographies consisting of 494,431,104 people shows a mild negative correlation between the proportion of Indians (Asian) and median family income in the United States with a correlation coefficient (R) of -0.368 and weighted average of $125,312. Similarly, the statistical analysis conducted on geographies consisting of 146,657,089 people shows a slight positive correlation between the proportion of Immigrants from Belgium and median family income in the United States with a correlation coefficient (R) of 0.053 and weighted average of $123,831, a difference of 1.2%.
Median Family Income Correlation Summary
| Measurement | Indian (Asian) | Immigrants from Belgium |
| Minimum | $56,023 | $38,056 |
| Maximum | $241,763 | $250,001 |
| Range | $185,740 | $211,945 |
| Mean | $131,617 | $128,845 |
| Median | $132,818 | $118,563 |
| Interquartile 25% (IQ1) | $104,858 | $88,684 |
| Interquartile 75% (IQ3) | $155,124 | $148,325 |
| Interquartile Range (IQR) | $50,266 | $59,642 |
| Standard Deviation (Sample) | $36,827 | $54,287 |
| Standard Deviation (Population) | $36,656 | $53,840 |
Demographics Similar to Indians (Asian) and Immigrants from Belgium by Median Family Income
In terms of median family income, the demographic groups most similar to Indians (Asian) are Immigrants from Eastern Asia ($125,150, a difference of 0.13%), Immigrants from China ($125,540, a difference of 0.18%), Eastern European ($125,546, a difference of 0.19%), Immigrants from South Central Asia ($125,956, a difference of 0.51%), and Immigrants from Australia ($126,620, a difference of 1.0%). Similarly, the demographic groups most similar to Immigrants from Belgium are Burmese ($123,369, a difference of 0.37%), Immigrants from Korea ($122,800, a difference of 0.84%), Immigrants from Sweden ($122,765, a difference of 0.87%), Immigrants from Japan ($122,764, a difference of 0.87%), and Immigrants from Eastern Asia ($125,150, a difference of 1.1%).
| Demographics | Rating | Rank | Median Family Income |
| Immigrants | Iran | 100.0 /100 | #8 | Exceptional $130,894 |
| Okinawans | 100.0 /100 | #9 | Exceptional $129,979 |
| Immigrants | Ireland | 100.0 /100 | #10 | Exceptional $127,584 |
| Immigrants | Israel | 100.0 /100 | #11 | Exceptional $127,430 |
| Cypriots | 100.0 /100 | #12 | Exceptional $127,064 |
| Immigrants | Australia | 100.0 /100 | #13 | Exceptional $126,620 |
| Immigrants | South Central Asia | 100.0 /100 | #14 | Exceptional $125,956 |
| Eastern Europeans | 100.0 /100 | #15 | Exceptional $125,546 |
| Immigrants | China | 100.0 /100 | #16 | Exceptional $125,540 |
| Indians (Asian) | 100.0 /100 | #17 | Exceptional $125,312 |
| Immigrants | Eastern Asia | 100.0 /100 | #18 | Exceptional $125,150 |
| Immigrants | Belgium | 100.0 /100 | #19 | Exceptional $123,831 |
| Burmese | 100.0 /100 | #20 | Exceptional $123,369 |
| Immigrants | Korea | 100.0 /100 | #21 | Exceptional $122,800 |
| Immigrants | Sweden | 100.0 /100 | #22 | Exceptional $122,765 |
| Immigrants | Japan | 100.0 /100 | #23 | Exceptional $122,764 |
| Immigrants | Northern Europe | 100.0 /100 | #24 | Exceptional $121,840 |
| Turks | 100.0 /100 | #25 | Exceptional $121,202 |
| Immigrants | Switzerland | 100.0 /100 | #26 | Exceptional $120,726 |
| Russians | 100.0 /100 | #27 | Exceptional $120,487 |
| Immigrants | Denmark | 100.0 /100 | #28 | Exceptional $120,445 |