White/Caucasian vs Chinese Median Family Income
COMPARE
White/Caucasian
Chinese
Median Family Income
Median Family Income Comparison
Whites/Caucasians
Chinese
$99,800
MEDIAN FAMILY INCOME
18.7/ 100
METRIC RATING
202nd/ 347
METRIC RANK
$116,188
MEDIAN FAMILY INCOME
99.9/ 100
METRIC RATING
49th/ 347
METRIC RANK
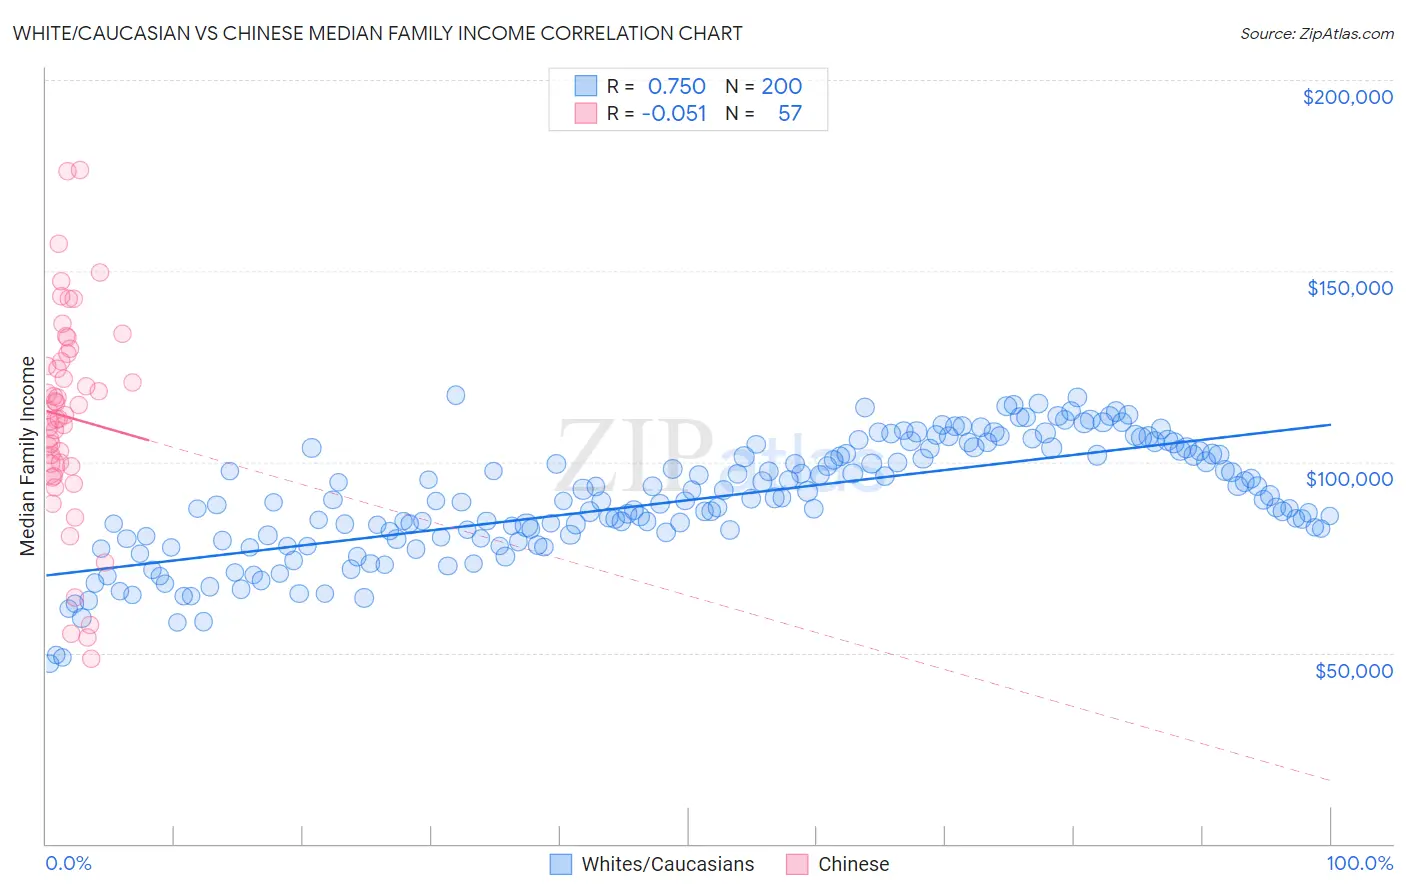
White/Caucasian vs Chinese Median Family Income Correlation Chart
The statistical analysis conducted on geographies consisting of 582,814,142 people shows a strong positive correlation between the proportion of Whites/Caucasians and median family income in the United States with a correlation coefficient (R) of 0.750 and weighted average of $99,800. Similarly, the statistical analysis conducted on geographies consisting of 64,799,903 people shows a slight negative correlation between the proportion of Chinese and median family income in the United States with a correlation coefficient (R) of -0.051 and weighted average of $116,188, a difference of 16.4%.
Median Family Income Correlation Summary
| Measurement | White/Caucasian | Chinese |
| Minimum | $47,087 | $48,295 |
| Maximum | $117,539 | $176,564 |
| Range | $70,452 | $128,269 |
| Mean | $89,997 | $111,811 |
| Median | $89,813 | $112,252 |
| Interquartile 25% (IQ1) | $80,036 | $98,862 |
| Interquartile 75% (IQ3) | $102,904 | $127,363 |
| Interquartile Range (IQR) | $22,868 | $28,501 |
| Standard Deviation (Sample) | $15,237 | $27,086 |
| Standard Deviation (Population) | $15,199 | $26,847 |
Similar Demographics by Median Family Income
Demographics Similar to Whites/Caucasians by Median Family Income
In terms of median family income, the demographic groups most similar to Whites/Caucasians are Immigrants from Thailand ($99,840, a difference of 0.040%), Spanish ($99,977, a difference of 0.18%), Scotch-Irish ($99,591, a difference of 0.21%), Yugoslavian ($100,119, a difference of 0.32%), and Immigrants from Africa ($100,256, a difference of 0.46%).
| Demographics | Rating | Rank | Median Family Income |
| Immigrants | South America | 23.9 /100 | #195 | Fair $100,414 |
| Samoans | 23.3 /100 | #196 | Fair $100,344 |
| Immigrants | Cameroon | 22.8 /100 | #197 | Fair $100,289 |
| Immigrants | Africa | 22.5 /100 | #198 | Fair $100,256 |
| Yugoslavians | 21.3 /100 | #199 | Fair $100,119 |
| Spanish | 20.1 /100 | #200 | Fair $99,977 |
| Immigrants | Thailand | 19.0 /100 | #201 | Poor $99,840 |
| Whites/Caucasians | 18.7 /100 | #202 | Poor $99,800 |
| Scotch-Irish | 17.1 /100 | #203 | Poor $99,591 |
| Ghanaians | 12.6 /100 | #204 | Poor $98,877 |
| Hawaiians | 12.5 /100 | #205 | Poor $98,869 |
| Immigrants | Iraq | 12.1 /100 | #206 | Poor $98,786 |
| Aleuts | 11.6 /100 | #207 | Poor $98,702 |
| Immigrants | Uruguay | 9.2 /100 | #208 | Tragic $98,205 |
| Immigrants | Colombia | 8.7 /100 | #209 | Tragic $98,067 |
Demographics Similar to Chinese by Median Family Income
In terms of median family income, the demographic groups most similar to Chinese are Immigrants from Czechoslovakia ($116,165, a difference of 0.020%), Immigrants from South Africa ($116,286, a difference of 0.080%), Immigrants from Malaysia ($115,880, a difference of 0.27%), Maltese ($115,862, a difference of 0.28%), and Immigrants from Norway ($115,847, a difference of 0.29%).
| Demographics | Rating | Rank | Median Family Income |
| Immigrants | Bolivia | 100.0 /100 | #42 | Exceptional $117,912 |
| Bulgarians | 100.0 /100 | #43 | Exceptional $117,818 |
| Cambodians | 100.0 /100 | #44 | Exceptional $117,780 |
| Immigrants | Greece | 99.9 /100 | #45 | Exceptional $117,344 |
| Immigrants | Russia | 99.9 /100 | #46 | Exceptional $116,942 |
| Immigrants | Austria | 99.9 /100 | #47 | Exceptional $116,830 |
| Immigrants | South Africa | 99.9 /100 | #48 | Exceptional $116,286 |
| Chinese | 99.9 /100 | #49 | Exceptional $116,188 |
| Immigrants | Czechoslovakia | 99.9 /100 | #50 | Exceptional $116,165 |
| Immigrants | Malaysia | 99.9 /100 | #51 | Exceptional $115,880 |
| Maltese | 99.9 /100 | #52 | Exceptional $115,862 |
| Immigrants | Norway | 99.9 /100 | #53 | Exceptional $115,847 |
| Immigrants | Europe | 99.9 /100 | #54 | Exceptional $115,523 |
| Lithuanians | 99.8 /100 | #55 | Exceptional $115,395 |
| New Zealanders | 99.8 /100 | #56 | Exceptional $115,230 |