Native/Alaskan vs Chinese Median Family Income
COMPARE
Native/Alaskan
Chinese
Median Family Income
Median Family Income Comparison
Natives/Alaskans
Chinese
$80,908
MEDIAN FAMILY INCOME
0.0/ 100
METRIC RATING
332nd/ 347
METRIC RANK
$116,188
MEDIAN FAMILY INCOME
99.9/ 100
METRIC RATING
49th/ 347
METRIC RANK
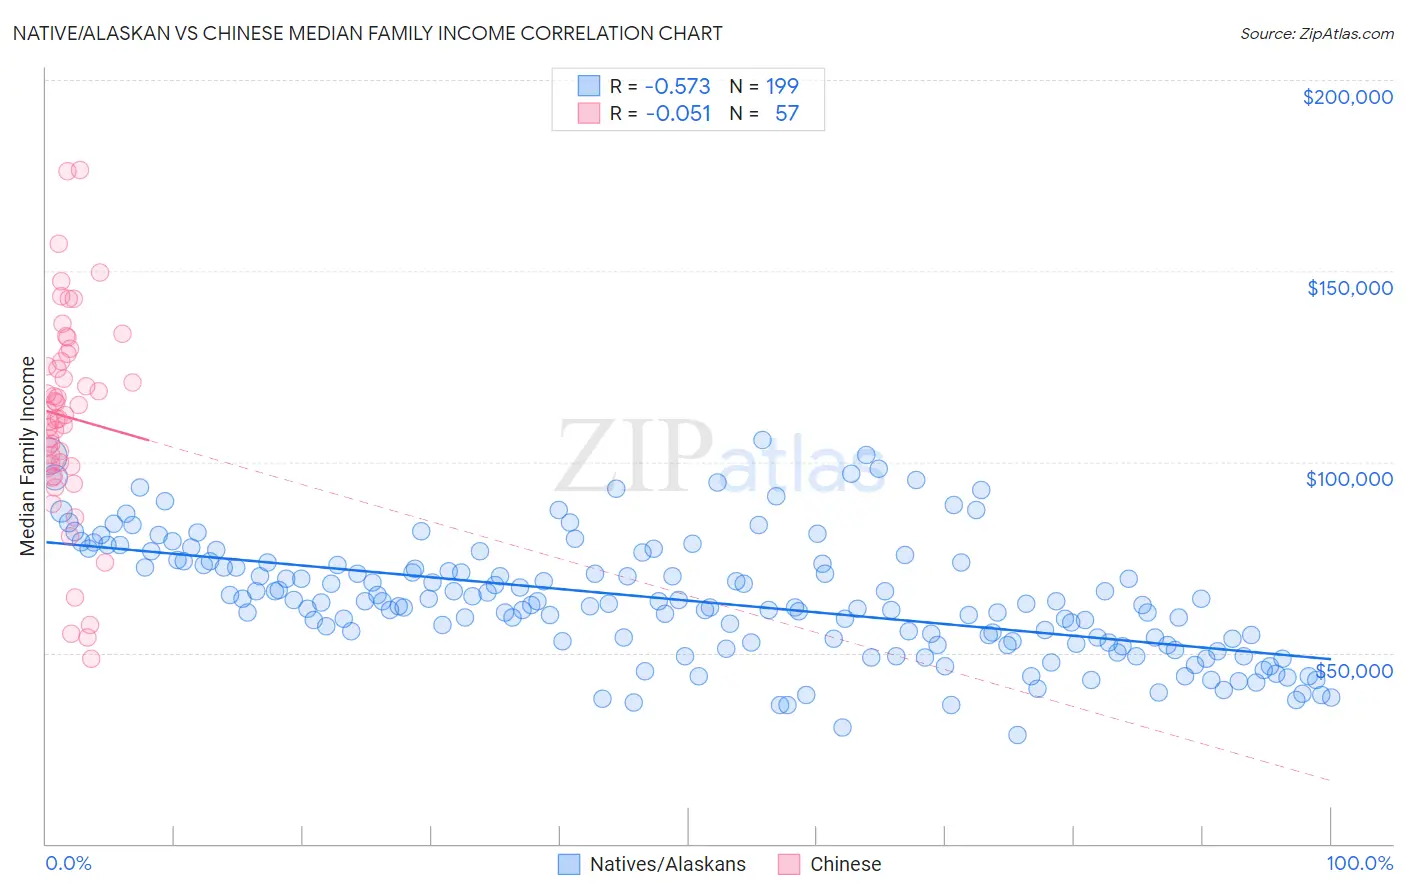
Native/Alaskan vs Chinese Median Family Income Correlation Chart
The statistical analysis conducted on geographies consisting of 512,223,526 people shows a substantial negative correlation between the proportion of Natives/Alaskans and median family income in the United States with a correlation coefficient (R) of -0.573 and weighted average of $80,908. Similarly, the statistical analysis conducted on geographies consisting of 64,799,903 people shows a slight negative correlation between the proportion of Chinese and median family income in the United States with a correlation coefficient (R) of -0.051 and weighted average of $116,188, a difference of 43.6%.
Median Family Income Correlation Summary
| Measurement | Native/Alaskan | Chinese |
| Minimum | $28,542 | $48,295 |
| Maximum | $105,692 | $176,564 |
| Range | $77,150 | $128,269 |
| Mean | $63,631 | $111,811 |
| Median | $62,694 | $112,252 |
| Interquartile 25% (IQ1) | $52,723 | $98,862 |
| Interquartile 75% (IQ3) | $73,193 | $127,363 |
| Interquartile Range (IQR) | $20,470 | $28,501 |
| Standard Deviation (Sample) | $15,516 | $27,086 |
| Standard Deviation (Population) | $15,477 | $26,847 |
Similar Demographics by Median Family Income
Demographics Similar to Natives/Alaskans by Median Family Income
In terms of median family income, the demographic groups most similar to Natives/Alaskans are Kiowa ($80,885, a difference of 0.030%), Immigrants from Dominican Republic ($81,233, a difference of 0.40%), Cheyenne ($81,385, a difference of 0.59%), Dutch West Indian ($81,852, a difference of 1.2%), and Black/African American ($81,912, a difference of 1.2%).
| Demographics | Rating | Rank | Median Family Income |
| Sioux | 0.0 /100 | #325 | Tragic $82,386 |
| Immigrants | Congo | 0.0 /100 | #326 | Tragic $82,216 |
| Arapaho | 0.0 /100 | #327 | Tragic $82,064 |
| Blacks/African Americans | 0.0 /100 | #328 | Tragic $81,912 |
| Dutch West Indians | 0.0 /100 | #329 | Tragic $81,852 |
| Cheyenne | 0.0 /100 | #330 | Tragic $81,385 |
| Immigrants | Dominican Republic | 0.0 /100 | #331 | Tragic $81,233 |
| Natives/Alaskans | 0.0 /100 | #332 | Tragic $80,908 |
| Kiowa | 0.0 /100 | #333 | Tragic $80,885 |
| Menominee | 0.0 /100 | #334 | Tragic $79,563 |
| Yup'ik | 0.0 /100 | #335 | Tragic $79,290 |
| Immigrants | Cuba | 0.0 /100 | #336 | Tragic $78,249 |
| Yuman | 0.0 /100 | #337 | Tragic $78,055 |
| Immigrants | Yemen | 0.0 /100 | #338 | Tragic $77,457 |
| Pima | 0.0 /100 | #339 | Tragic $77,431 |
Demographics Similar to Chinese by Median Family Income
In terms of median family income, the demographic groups most similar to Chinese are Immigrants from Czechoslovakia ($116,165, a difference of 0.020%), Immigrants from South Africa ($116,286, a difference of 0.080%), Immigrants from Malaysia ($115,880, a difference of 0.27%), Maltese ($115,862, a difference of 0.28%), and Immigrants from Norway ($115,847, a difference of 0.29%).
| Demographics | Rating | Rank | Median Family Income |
| Immigrants | Bolivia | 100.0 /100 | #42 | Exceptional $117,912 |
| Bulgarians | 100.0 /100 | #43 | Exceptional $117,818 |
| Cambodians | 100.0 /100 | #44 | Exceptional $117,780 |
| Immigrants | Greece | 99.9 /100 | #45 | Exceptional $117,344 |
| Immigrants | Russia | 99.9 /100 | #46 | Exceptional $116,942 |
| Immigrants | Austria | 99.9 /100 | #47 | Exceptional $116,830 |
| Immigrants | South Africa | 99.9 /100 | #48 | Exceptional $116,286 |
| Chinese | 99.9 /100 | #49 | Exceptional $116,188 |
| Immigrants | Czechoslovakia | 99.9 /100 | #50 | Exceptional $116,165 |
| Immigrants | Malaysia | 99.9 /100 | #51 | Exceptional $115,880 |
| Maltese | 99.9 /100 | #52 | Exceptional $115,862 |
| Immigrants | Norway | 99.9 /100 | #53 | Exceptional $115,847 |
| Immigrants | Europe | 99.9 /100 | #54 | Exceptional $115,523 |
| Lithuanians | 99.8 /100 | #55 | Exceptional $115,395 |
| New Zealanders | 99.8 /100 | #56 | Exceptional $115,230 |