Immigrants from France vs Chinese Median Family Income
COMPARE
Immigrants from France
Chinese
Median Family Income
Median Family Income Comparison
Immigrants from France
Chinese
$120,076
MEDIAN FAMILY INCOME
100.0/ 100
METRIC RATING
31st/ 347
METRIC RANK
$116,188
MEDIAN FAMILY INCOME
99.9/ 100
METRIC RATING
49th/ 347
METRIC RANK
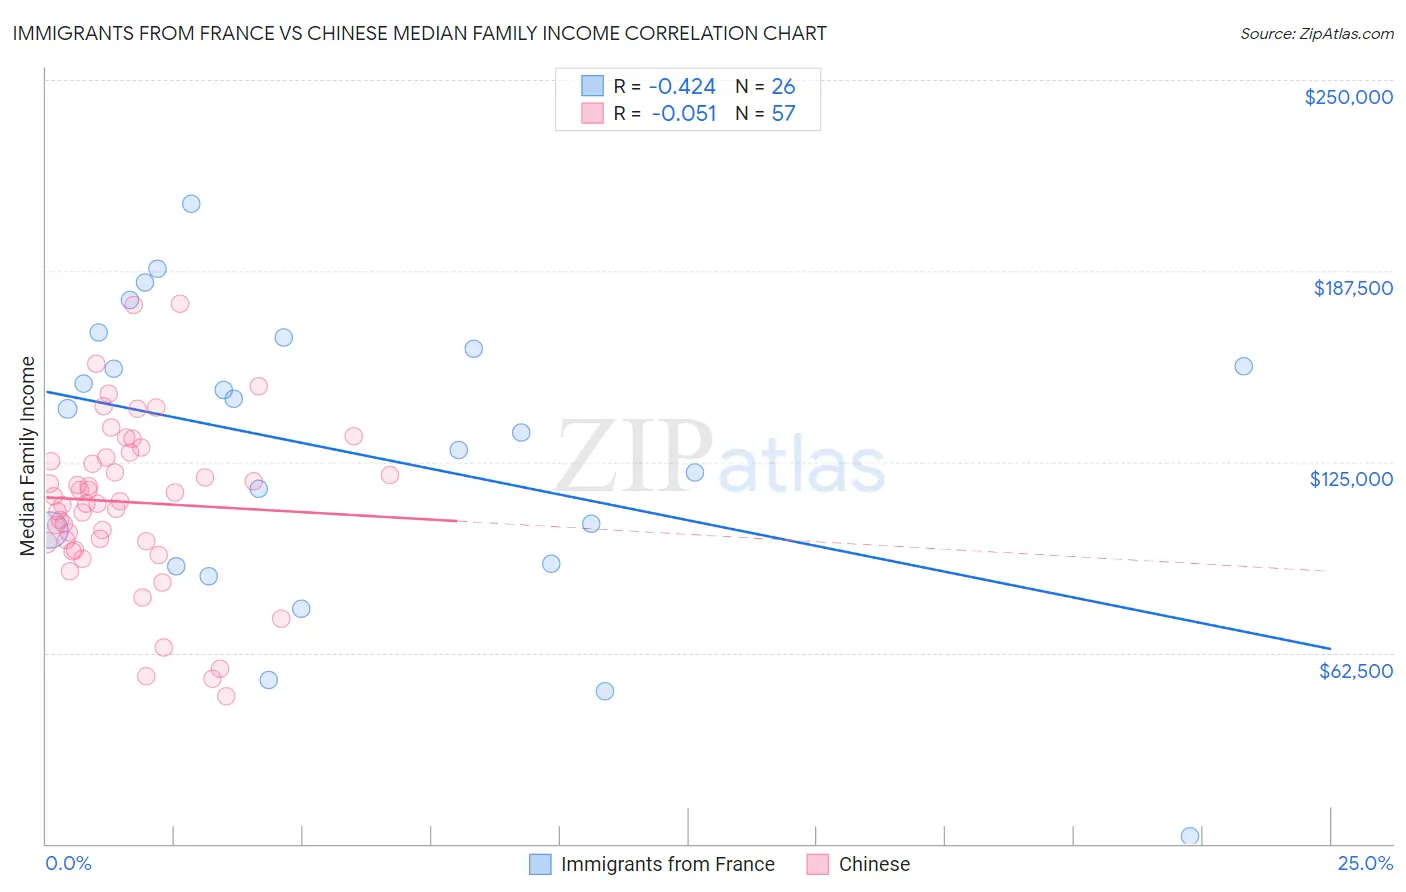
Immigrants from France vs Chinese Median Family Income Correlation Chart
The statistical analysis conducted on geographies consisting of 287,827,104 people shows a moderate negative correlation between the proportion of Immigrants from France and median family income in the United States with a correlation coefficient (R) of -0.424 and weighted average of $120,076. Similarly, the statistical analysis conducted on geographies consisting of 64,799,903 people shows a slight negative correlation between the proportion of Chinese and median family income in the United States with a correlation coefficient (R) of -0.051 and weighted average of $116,188, a difference of 3.4%.
Median Family Income Correlation Summary
| Measurement | Immigrants from France | Chinese |
| Minimum | $2,499 | $48,295 |
| Maximum | $209,360 | $176,564 |
| Range | $206,861 | $128,269 |
| Mean | $127,499 | $111,811 |
| Median | $138,617 | $112,252 |
| Interquartile 25% (IQ1) | $91,458 | $98,862 |
| Interquartile 75% (IQ3) | $162,000 | $127,363 |
| Interquartile Range (IQR) | $70,542 | $28,501 |
| Standard Deviation (Sample) | $48,457 | $27,086 |
| Standard Deviation (Population) | $47,516 | $26,847 |
Demographics Similar to Immigrants from France and Chinese by Median Family Income
In terms of median family income, the demographic groups most similar to Immigrants from France are Asian ($119,955, a difference of 0.10%), Immigrants from Sri Lanka ($120,263, a difference of 0.16%), Bhutanese ($119,800, a difference of 0.23%), Bolivian ($119,479, a difference of 0.50%), and Soviet Union ($119,262, a difference of 0.68%). Similarly, the demographic groups most similar to Chinese are Immigrants from Czechoslovakia ($116,165, a difference of 0.020%), Immigrants from South Africa ($116,286, a difference of 0.080%), Immigrants from Austria ($116,830, a difference of 0.55%), Immigrants from Russia ($116,942, a difference of 0.65%), and Immigrants from Greece ($117,344, a difference of 0.99%).
| Demographics | Rating | Rank | Median Family Income |
| Immigrants | Sri Lanka | 100.0 /100 | #30 | Exceptional $120,263 |
| Immigrants | France | 100.0 /100 | #31 | Exceptional $120,076 |
| Asians | 100.0 /100 | #32 | Exceptional $119,955 |
| Bhutanese | 100.0 /100 | #33 | Exceptional $119,800 |
| Bolivians | 100.0 /100 | #34 | Exceptional $119,479 |
| Soviet Union | 100.0 /100 | #35 | Exceptional $119,262 |
| Israelis | 100.0 /100 | #36 | Exceptional $118,577 |
| Australians | 100.0 /100 | #37 | Exceptional $118,440 |
| Immigrants | Turkey | 100.0 /100 | #38 | Exceptional $118,325 |
| Immigrants | Asia | 100.0 /100 | #39 | Exceptional $118,291 |
| Immigrants | Lithuania | 100.0 /100 | #40 | Exceptional $118,053 |
| Estonians | 100.0 /100 | #41 | Exceptional $118,013 |
| Immigrants | Bolivia | 100.0 /100 | #42 | Exceptional $117,912 |
| Bulgarians | 100.0 /100 | #43 | Exceptional $117,818 |
| Cambodians | 100.0 /100 | #44 | Exceptional $117,780 |
| Immigrants | Greece | 99.9 /100 | #45 | Exceptional $117,344 |
| Immigrants | Russia | 99.9 /100 | #46 | Exceptional $116,942 |
| Immigrants | Austria | 99.9 /100 | #47 | Exceptional $116,830 |
| Immigrants | South Africa | 99.9 /100 | #48 | Exceptional $116,286 |
| Chinese | 99.9 /100 | #49 | Exceptional $116,188 |
| Immigrants | Czechoslovakia | 99.9 /100 | #50 | Exceptional $116,165 |