White/Caucasian vs African 12th Grade, No Diploma
COMPARE
White/Caucasian
African
12th Grade, No Diploma
12th Grade, No Diploma Comparison
Whites/Caucasians
Africans
91.8%
12TH GRADE, NO DIPLOMA
91.6/ 100
METRIC RATING
125th/ 347
METRIC RANK
89.6%
12TH GRADE, NO DIPLOMA
0.4/ 100
METRIC RATING
258th/ 347
METRIC RANK
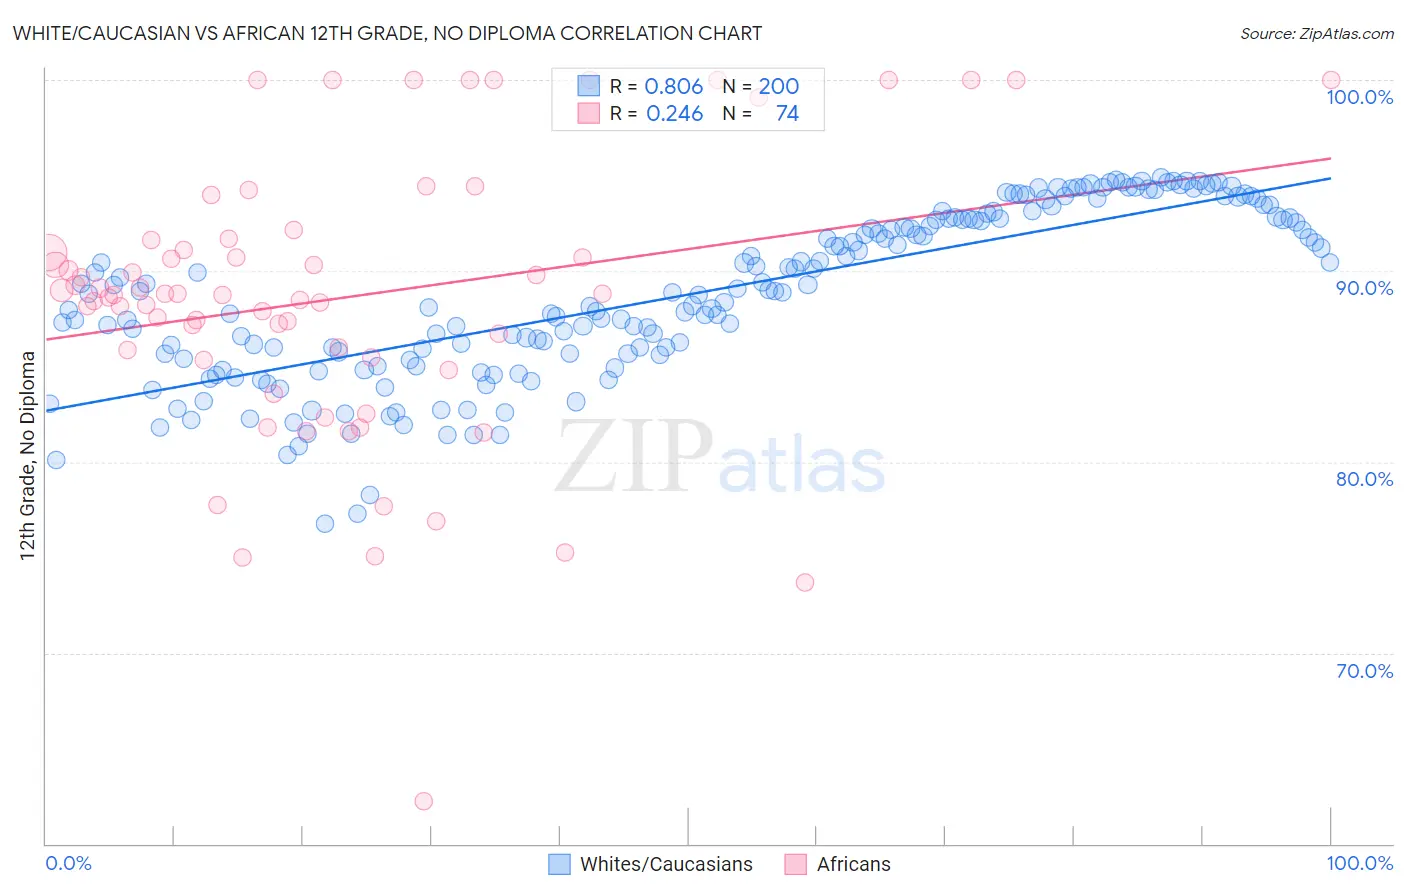
White/Caucasian vs African 12th Grade, No Diploma Correlation Chart
The statistical analysis conducted on geographies consisting of 585,243,214 people shows a very strong positive correlation between the proportion of Whites/Caucasians and percentage of population with at least 12th grade (no diploma) education in the United States with a correlation coefficient (R) of 0.806 and weighted average of 91.8%. Similarly, the statistical analysis conducted on geographies consisting of 470,094,658 people shows a weak positive correlation between the proportion of Africans and percentage of population with at least 12th grade (no diploma) education in the United States with a correlation coefficient (R) of 0.246 and weighted average of 89.6%, a difference of 2.5%.
12th Grade, No Diploma Correlation Summary
| Measurement | White/Caucasian | African |
| Minimum | 76.8% | 62.2% |
| Maximum | 94.9% | 100.0% |
| Range | 18.1% | 37.8% |
| Mean | 88.8% | 88.6% |
| Median | 88.9% | 88.8% |
| Interquartile 25% (IQ1) | 85.6% | 85.4% |
| Interquartile 75% (IQ3) | 92.7% | 91.6% |
| Interquartile Range (IQR) | 7.1% | 6.2% |
| Standard Deviation (Sample) | 4.4% | 7.4% |
| Standard Deviation (Population) | 4.4% | 7.3% |
Similar Demographics by 12th Grade, No Diploma
Demographics Similar to Whites/Caucasians by 12th Grade, No Diploma
In terms of 12th grade, no diploma, the demographic groups most similar to Whites/Caucasians are Immigrants from Ukraine (91.8%, a difference of 0.0%), Basque (91.8%, a difference of 0.010%), Immigrants from Jordan (91.8%, a difference of 0.020%), Egyptian (91.9%, a difference of 0.040%), and Mongolian (91.8%, a difference of 0.060%).
| Demographics | Rating | Rank | 12th Grade, No Diploma |
| Puget Sound Salish | 95.8 /100 | #118 | Exceptional 92.0% |
| Immigrants | Germany | 95.5 /100 | #119 | Exceptional 92.0% |
| Immigrants | Kazakhstan | 94.2 /100 | #120 | Exceptional 91.9% |
| Menominee | 93.5 /100 | #121 | Exceptional 91.9% |
| Ottawa | 93.1 /100 | #122 | Exceptional 91.9% |
| Egyptians | 92.5 /100 | #123 | Exceptional 91.9% |
| Immigrants | Ukraine | 91.6 /100 | #124 | Exceptional 91.8% |
| Whites/Caucasians | 91.6 /100 | #125 | Exceptional 91.8% |
| Basques | 91.3 /100 | #126 | Exceptional 91.8% |
| Immigrants | Jordan | 91.0 /100 | #127 | Exceptional 91.8% |
| Mongolians | 89.9 /100 | #128 | Excellent 91.8% |
| German Russians | 89.8 /100 | #129 | Excellent 91.8% |
| Assyrians/Chaldeans/Syriacs | 89.6 /100 | #130 | Excellent 91.8% |
| Albanians | 89.3 /100 | #131 | Excellent 91.8% |
| Immigrants | Eastern Asia | 89.3 /100 | #132 | Excellent 91.8% |
Demographics Similar to Africans by 12th Grade, No Diploma
In terms of 12th grade, no diploma, the demographic groups most similar to Africans are Immigrants from Western Africa (89.6%, a difference of 0.020%), Immigrants from South Eastern Asia (89.6%, a difference of 0.040%), Cheyenne (89.6%, a difference of 0.040%), Sioux (89.6%, a difference of 0.040%), and Immigrants from Ghana (89.7%, a difference of 0.050%).
| Demographics | Rating | Rank | 12th Grade, No Diploma |
| Spanish Americans | 0.9 /100 | #251 | Tragic 89.9% |
| Bahamians | 0.9 /100 | #252 | Tragic 89.9% |
| Choctaw | 0.7 /100 | #253 | Tragic 89.8% |
| Immigrants | Peru | 0.5 /100 | #254 | Tragic 89.7% |
| Immigrants | Senegal | 0.5 /100 | #255 | Tragic 89.7% |
| Immigrants | Ghana | 0.5 /100 | #256 | Tragic 89.7% |
| Jamaicans | 0.5 /100 | #257 | Tragic 89.7% |
| Africans | 0.4 /100 | #258 | Tragic 89.6% |
| Immigrants | Western Africa | 0.4 /100 | #259 | Tragic 89.6% |
| Immigrants | South Eastern Asia | 0.4 /100 | #260 | Tragic 89.6% |
| Cheyenne | 0.4 /100 | #261 | Tragic 89.6% |
| Sioux | 0.4 /100 | #262 | Tragic 89.6% |
| Immigrants | Jamaica | 0.2 /100 | #263 | Tragic 89.5% |
| Sri Lankans | 0.2 /100 | #264 | Tragic 89.4% |
| Trinidadians and Tobagonians | 0.2 /100 | #265 | Tragic 89.4% |