Armenian vs African Median Family Income
COMPARE
Armenian
African
Median Family Income
Median Family Income Comparison
Armenians
Africans
$109,692
MEDIAN FAMILY INCOME
97.3/ 100
METRIC RATING
99th/ 347
METRIC RANK
$87,820
MEDIAN FAMILY INCOME
0.1/ 100
METRIC RATING
292nd/ 347
METRIC RANK
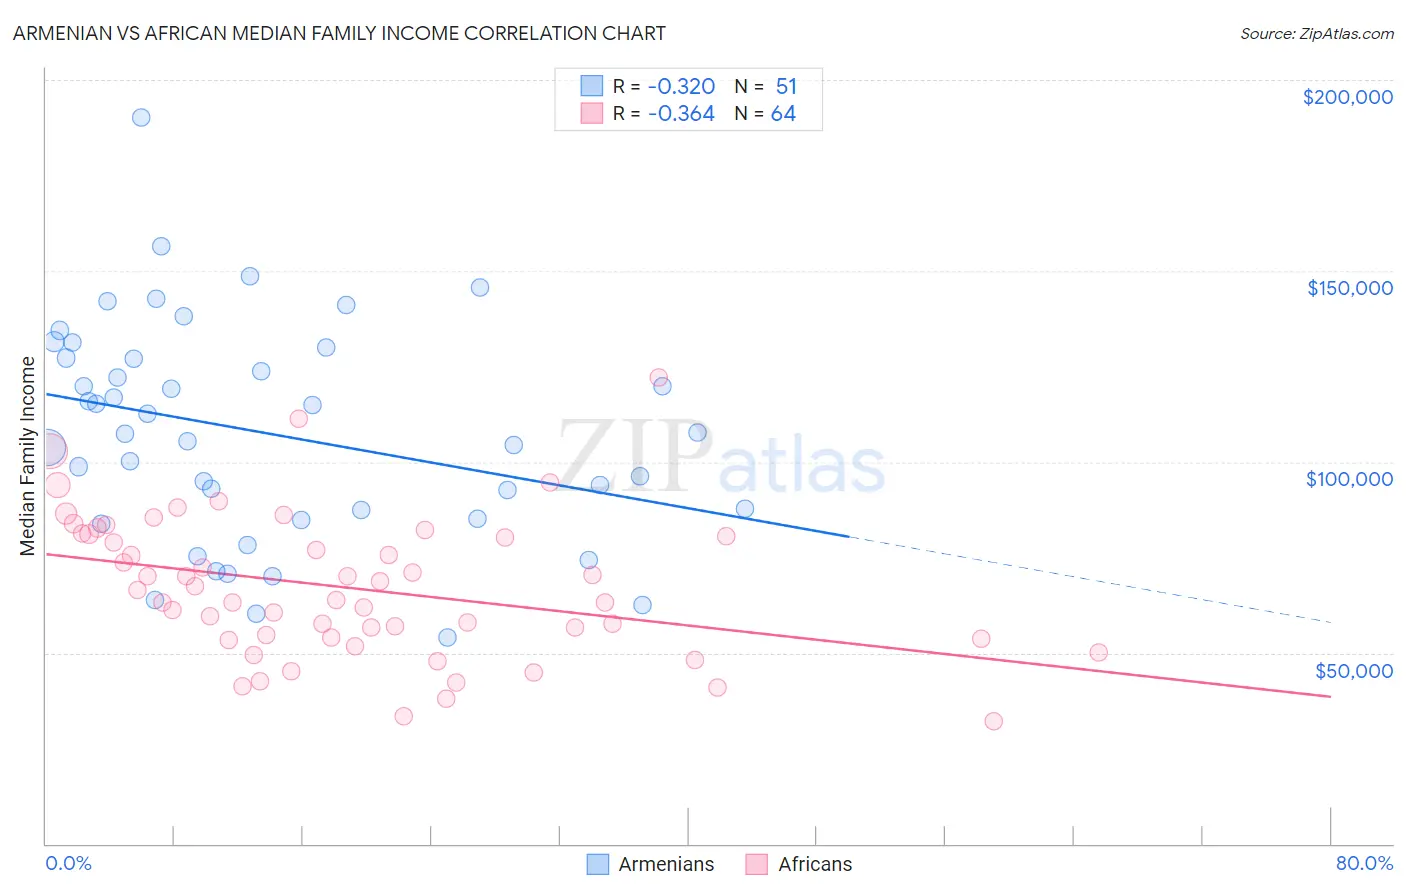
Armenian vs African Median Family Income Correlation Chart
The statistical analysis conducted on geographies consisting of 310,689,637 people shows a mild negative correlation between the proportion of Armenians and median family income in the United States with a correlation coefficient (R) of -0.320 and weighted average of $109,692. Similarly, the statistical analysis conducted on geographies consisting of 469,326,799 people shows a mild negative correlation between the proportion of Africans and median family income in the United States with a correlation coefficient (R) of -0.364 and weighted average of $87,820, a difference of 24.9%.
Median Family Income Correlation Summary
| Measurement | Armenian | African |
| Minimum | $54,063 | $32,021 |
| Maximum | $190,202 | $122,080 |
| Range | $136,139 | $90,059 |
| Mean | $107,343 | $66,990 |
| Median | $107,236 | $65,223 |
| Interquartile 25% (IQ1) | $85,128 | $53,783 |
| Interquartile 75% (IQ3) | $127,200 | $80,861 |
| Interquartile Range (IQR) | $42,071 | $27,078 |
| Standard Deviation (Sample) | $28,557 | $18,626 |
| Standard Deviation (Population) | $28,276 | $18,480 |
Similar Demographics by Median Family Income
Demographics Similar to Armenians by Median Family Income
In terms of median family income, the demographic groups most similar to Armenians are Macedonian ($109,668, a difference of 0.020%), Immigrants from Kuwait ($109,731, a difference of 0.040%), Immigrants from Ukraine ($109,645, a difference of 0.040%), Assyrian/Chaldean/Syriac ($109,622, a difference of 0.060%), and Jordanian ($109,865, a difference of 0.16%).
| Demographics | Rating | Rank | Median Family Income |
| Immigrants | Lebanon | 97.9 /100 | #92 | Exceptional $110,159 |
| Immigrants | Kazakhstan | 97.8 /100 | #93 | Exceptional $110,137 |
| Koreans | 97.8 /100 | #94 | Exceptional $110,103 |
| Zimbabweans | 97.7 /100 | #95 | Exceptional $110,011 |
| Immigrants | Moldova | 97.7 /100 | #96 | Exceptional $109,975 |
| Jordanians | 97.5 /100 | #97 | Exceptional $109,865 |
| Immigrants | Kuwait | 97.4 /100 | #98 | Exceptional $109,731 |
| Armenians | 97.3 /100 | #99 | Exceptional $109,692 |
| Macedonians | 97.3 /100 | #100 | Exceptional $109,668 |
| Immigrants | Ukraine | 97.2 /100 | #101 | Exceptional $109,645 |
| Assyrians/Chaldeans/Syriacs | 97.2 /100 | #102 | Exceptional $109,622 |
| Immigrants | Brazil | 96.9 /100 | #103 | Exceptional $109,418 |
| Palestinians | 96.9 /100 | #104 | Exceptional $109,413 |
| Syrians | 96.7 /100 | #105 | Exceptional $109,299 |
| Albanians | 96.4 /100 | #106 | Exceptional $109,136 |
Demographics Similar to Africans by Median Family Income
In terms of median family income, the demographic groups most similar to Africans are Immigrants from Cabo Verde ($87,830, a difference of 0.010%), Shoshone ($87,872, a difference of 0.060%), Central American Indian ($88,034, a difference of 0.24%), Ute ($87,596, a difference of 0.26%), and Cherokee ($88,209, a difference of 0.44%).
| Demographics | Rating | Rank | Median Family Income |
| Guatemalans | 0.1 /100 | #285 | Tragic $88,295 |
| Immigrants | Nicaragua | 0.1 /100 | #286 | Tragic $88,267 |
| Potawatomi | 0.1 /100 | #287 | Tragic $88,265 |
| Cherokee | 0.1 /100 | #288 | Tragic $88,209 |
| Central American Indians | 0.1 /100 | #289 | Tragic $88,034 |
| Shoshone | 0.1 /100 | #290 | Tragic $87,872 |
| Immigrants | Cabo Verde | 0.1 /100 | #291 | Tragic $87,830 |
| Africans | 0.1 /100 | #292 | Tragic $87,820 |
| Ute | 0.0 /100 | #293 | Tragic $87,596 |
| Fijians | 0.0 /100 | #294 | Tragic $87,387 |
| Yaqui | 0.0 /100 | #295 | Tragic $87,289 |
| Immigrants | Guatemala | 0.0 /100 | #296 | Tragic $87,191 |
| Cajuns | 0.0 /100 | #297 | Tragic $87,157 |
| Immigrants | Latin America | 0.0 /100 | #298 | Tragic $86,989 |
| Chippewa | 0.0 /100 | #299 | Tragic $86,852 |