Welsh vs Immigrants from Poland Unemployment
COMPARE
Welsh
Immigrants from Poland
Unemployment
Unemployment Comparison
Welsh
Immigrants from Poland
4.7%
UNEMPLOYMENT
99.9/ 100
METRIC RATING
21st/ 347
METRIC RANK
5.3%
UNEMPLOYMENT
51.8/ 100
METRIC RATING
173rd/ 347
METRIC RANK
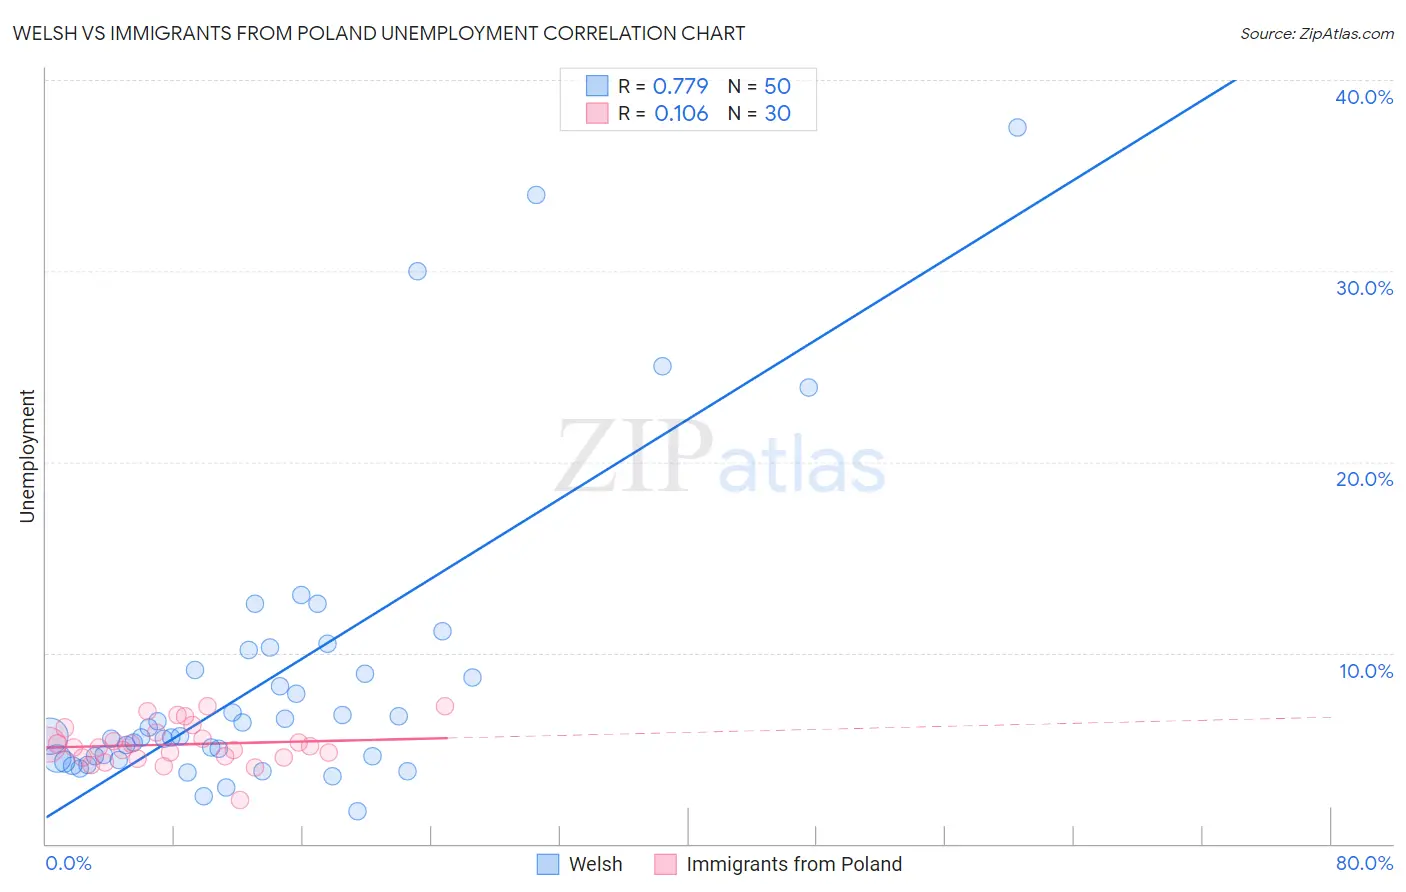
Welsh vs Immigrants from Poland Unemployment Correlation Chart
The statistical analysis conducted on geographies consisting of 526,178,789 people shows a strong positive correlation between the proportion of Welsh and unemployment in the United States with a correlation coefficient (R) of 0.779 and weighted average of 4.7%. Similarly, the statistical analysis conducted on geographies consisting of 304,663,845 people shows a poor positive correlation between the proportion of Immigrants from Poland and unemployment in the United States with a correlation coefficient (R) of 0.106 and weighted average of 5.3%, a difference of 12.0%.
Unemployment Correlation Summary
| Measurement | Welsh | Immigrants from Poland |
| Minimum | 1.7% | 2.3% |
| Maximum | 37.5% | 7.2% |
| Range | 35.8% | 4.9% |
| Mean | 8.7% | 5.2% |
| Median | 5.6% | 5.1% |
| Interquartile 25% (IQ1) | 4.5% | 4.5% |
| Interquartile 75% (IQ3) | 9.1% | 5.8% |
| Interquartile Range (IQR) | 4.7% | 1.3% |
| Standard Deviation (Sample) | 7.8% | 1.1% |
| Standard Deviation (Population) | 7.8% | 1.1% |
Similar Demographics by Unemployment
Demographics Similar to Welsh by Unemployment
In terms of unemployment, the demographic groups most similar to Welsh are Thai (4.7%, a difference of 0.0%), Carpatho Rusyn (4.7%, a difference of 0.020%), British (4.7%, a difference of 0.30%), Venezuelan (4.7%, a difference of 0.38%), and Latvian (4.7%, a difference of 0.45%).
| Demographics | Rating | Rank | Unemployment |
| Immigrants | Cuba | 100.0 /100 | #14 | Exceptional 4.6% |
| Europeans | 99.9 /100 | #15 | Exceptional 4.6% |
| Chinese | 99.9 /100 | #16 | Exceptional 4.7% |
| Slovenes | 99.9 /100 | #17 | Exceptional 4.7% |
| Immigrants | Venezuela | 99.9 /100 | #18 | Exceptional 4.7% |
| Scottish | 99.9 /100 | #19 | Exceptional 4.7% |
| Carpatho Rusyns | 99.9 /100 | #20 | Exceptional 4.7% |
| Welsh | 99.9 /100 | #21 | Exceptional 4.7% |
| Thais | 99.9 /100 | #22 | Exceptional 4.7% |
| British | 99.9 /100 | #23 | Exceptional 4.7% |
| Venezuelans | 99.9 /100 | #24 | Exceptional 4.7% |
| Latvians | 99.9 /100 | #25 | Exceptional 4.7% |
| Bulgarians | 99.9 /100 | #26 | Exceptional 4.7% |
| Finns | 99.9 /100 | #27 | Exceptional 4.7% |
| Cubans | 99.8 /100 | #28 | Exceptional 4.7% |
Demographics Similar to Immigrants from Poland by Unemployment
In terms of unemployment, the demographic groups most similar to Immigrants from Poland are Immigrants from Vietnam (5.2%, a difference of 0.040%), Immigrants from Congo (5.3%, a difference of 0.11%), Taiwanese (5.3%, a difference of 0.13%), Nicaraguan (5.3%, a difference of 0.19%), and Nonimmigrants (5.3%, a difference of 0.24%).
| Demographics | Rating | Rank | Unemployment |
| Immigrants | Indonesia | 61.2 /100 | #166 | Good 5.2% |
| Colombians | 61.1 /100 | #167 | Good 5.2% |
| Uruguayans | 60.2 /100 | #168 | Good 5.2% |
| Immigrants | Morocco | 59.1 /100 | #169 | Average 5.2% |
| Immigrants | Nicaragua | 57.1 /100 | #170 | Average 5.2% |
| Puget Sound Salish | 56.6 /100 | #171 | Average 5.2% |
| Immigrants | Vietnam | 52.5 /100 | #172 | Average 5.2% |
| Immigrants | Poland | 51.8 /100 | #173 | Average 5.3% |
| Immigrants | Congo | 50.0 /100 | #174 | Average 5.3% |
| Taiwanese | 49.6 /100 | #175 | Average 5.3% |
| Nicaraguans | 48.7 /100 | #176 | Average 5.3% |
| Immigrants | Nonimmigrants | 47.9 /100 | #177 | Average 5.3% |
| Afghans | 47.4 /100 | #178 | Average 5.3% |
| Malaysians | 46.8 /100 | #179 | Average 5.3% |
| Immigrants | Greece | 45.0 /100 | #180 | Average 5.3% |