Welsh vs Immigrants from Poland Professional Degree
COMPARE
Welsh
Immigrants from Poland
Professional Degree
Professional Degree Comparison
Welsh
Immigrants from Poland
4.3%
PROFESSIONAL DEGREE
35.8/ 100
METRIC RATING
185th/ 347
METRIC RANK
4.3%
PROFESSIONAL DEGREE
29.2/ 100
METRIC RATING
190th/ 347
METRIC RANK
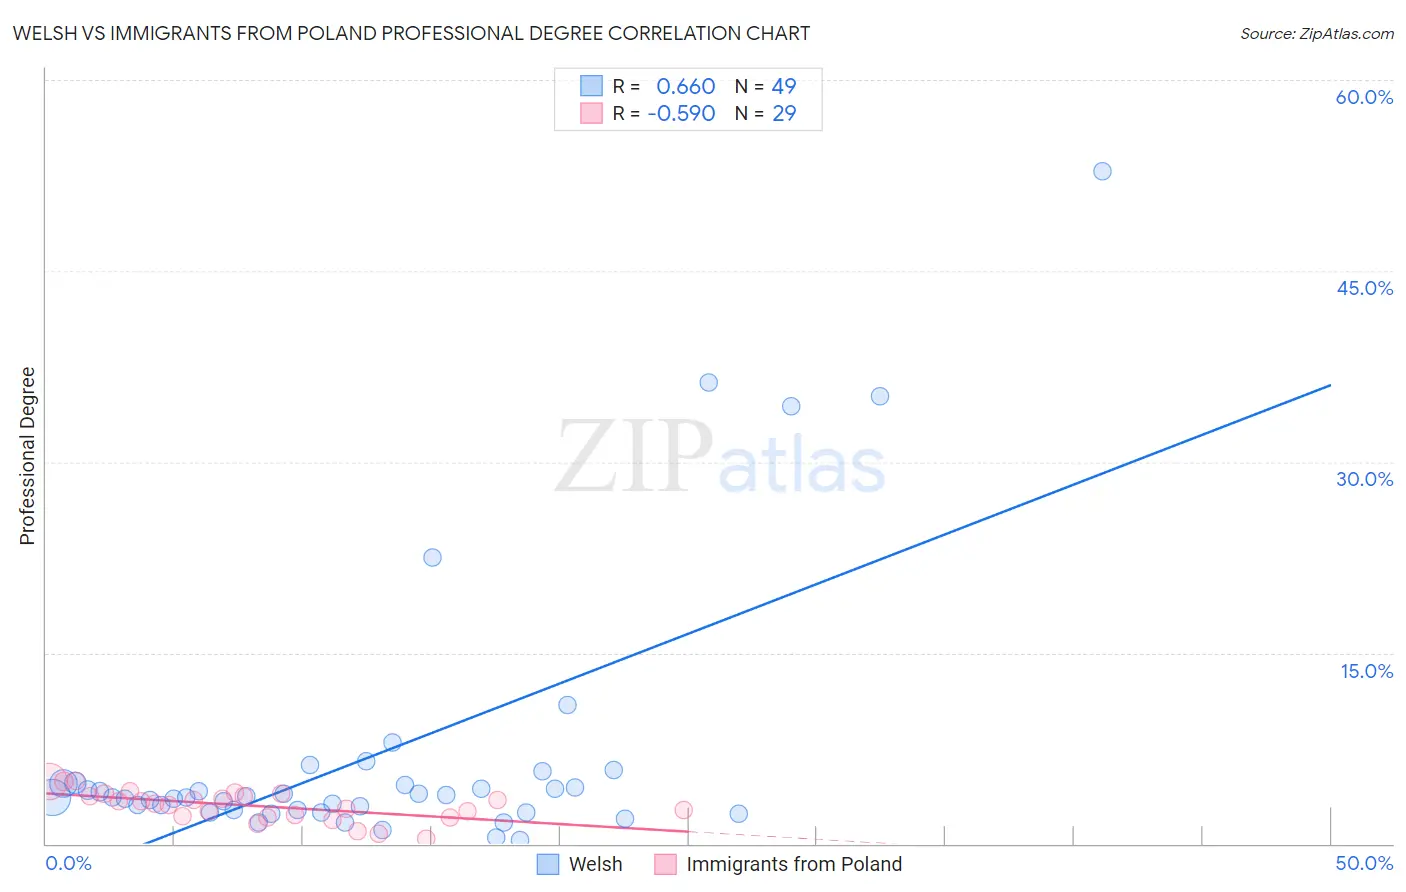
Welsh vs Immigrants from Poland Professional Degree Correlation Chart
The statistical analysis conducted on geographies consisting of 523,806,417 people shows a significant positive correlation between the proportion of Welsh and percentage of population with at least professional degree education in the United States with a correlation coefficient (R) of 0.660 and weighted average of 4.3%. Similarly, the statistical analysis conducted on geographies consisting of 304,504,967 people shows a substantial negative correlation between the proportion of Immigrants from Poland and percentage of population with at least professional degree education in the United States with a correlation coefficient (R) of -0.590 and weighted average of 4.3%, a difference of 1.1%.
Professional Degree Correlation Summary
| Measurement | Welsh | Immigrants from Poland |
| Minimum | 0.26% | 0.35% |
| Maximum | 52.8% | 4.9% |
| Range | 52.6% | 4.6% |
| Mean | 7.0% | 3.0% |
| Median | 3.6% | 3.1% |
| Interquartile 25% (IQ1) | 2.5% | 2.1% |
| Interquartile 75% (IQ3) | 4.8% | 3.8% |
| Interquartile Range (IQR) | 2.2% | 1.7% |
| Standard Deviation (Sample) | 10.6% | 1.2% |
| Standard Deviation (Population) | 10.5% | 1.2% |
Demographics Similar to Welsh and Immigrants from Poland by Professional Degree
In terms of professional degree, the demographic groups most similar to Welsh are Belgian (4.3%, a difference of 0.060%), Scotch-Irish (4.3%, a difference of 0.27%), Immigrants from Cameroon (4.3%, a difference of 0.42%), Immigrants from Thailand (4.3%, a difference of 0.69%), and Slovak (4.3%, a difference of 0.87%). Similarly, the demographic groups most similar to Immigrants from Poland are Sri Lankan (4.3%, a difference of 0.040%), Slovak (4.3%, a difference of 0.26%), Ghanaian (4.3%, a difference of 0.36%), French (4.2%, a difference of 0.40%), and Immigrants from Thailand (4.3%, a difference of 0.44%).
| Demographics | Rating | Rank | Professional Degree |
| Celtics | 47.6 /100 | #177 | Average 4.4% |
| Immigrants | Costa Rica | 46.7 /100 | #178 | Average 4.4% |
| Immigrants | Kenya | 45.9 /100 | #179 | Average 4.4% |
| Czechs | 44.9 /100 | #180 | Average 4.4% |
| Danes | 43.5 /100 | #181 | Average 4.4% |
| Immigrants | Immigrants | 43.2 /100 | #182 | Average 4.4% |
| Bermudans | 43.1 /100 | #183 | Average 4.4% |
| Belgians | 36.2 /100 | #184 | Fair 4.3% |
| Welsh | 35.8 /100 | #185 | Fair 4.3% |
| Scotch-Irish | 34.2 /100 | #186 | Fair 4.3% |
| Immigrants | Cameroon | 33.3 /100 | #187 | Fair 4.3% |
| Immigrants | Thailand | 31.7 /100 | #188 | Fair 4.3% |
| Slovaks | 30.7 /100 | #189 | Fair 4.3% |
| Immigrants | Poland | 29.2 /100 | #190 | Fair 4.3% |
| Sri Lankans | 29.0 /100 | #191 | Fair 4.3% |
| Ghanaians | 27.3 /100 | #192 | Fair 4.3% |
| French | 27.1 /100 | #193 | Fair 4.2% |
| Scandinavians | 25.8 /100 | #194 | Fair 4.2% |
| Nigerians | 24.6 /100 | #195 | Fair 4.2% |
| Spanish | 23.0 /100 | #196 | Fair 4.2% |
| Czechoslovakians | 22.4 /100 | #197 | Fair 4.2% |